980 User Guide Rev. B29
Page 66 August 5, 2011
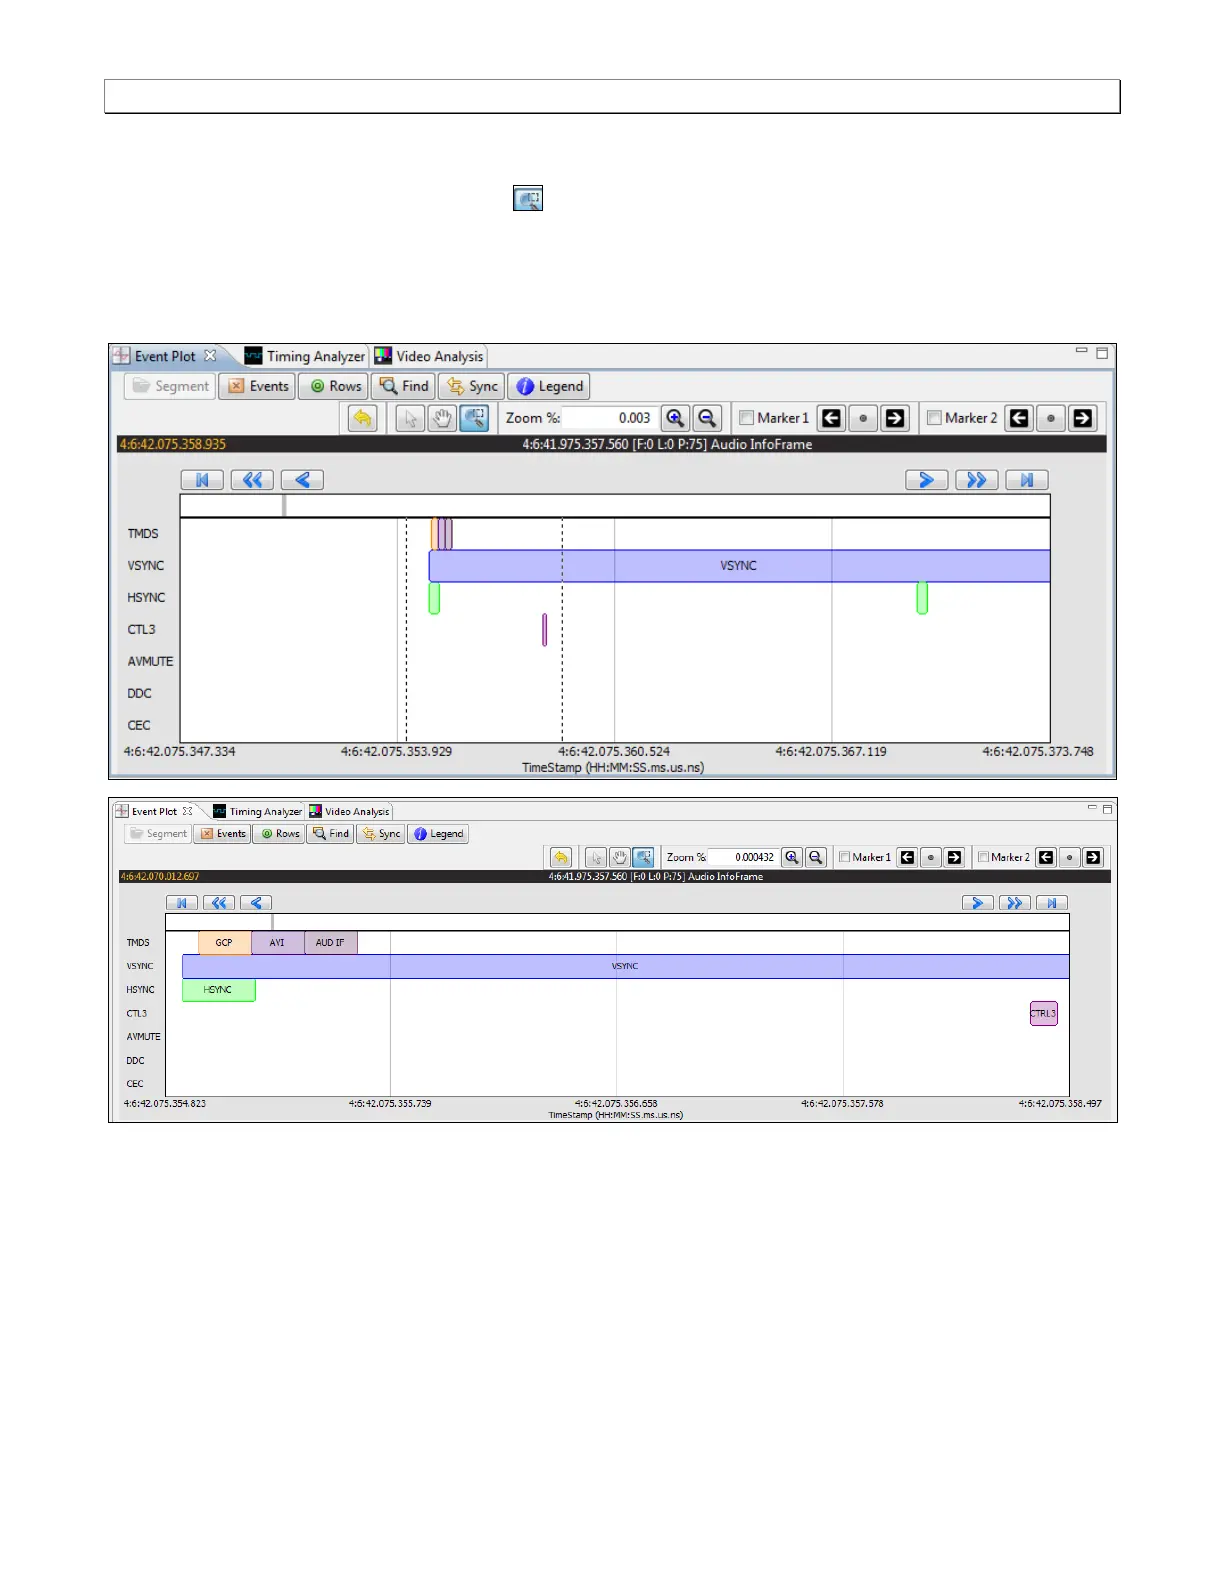
4.5.4 Surrounding and Zooming
The Event Plot provides a Range Zoom tool . You can select an area of the Event Plot by clicking and
dragging across. When you do this the new view will be limited to the horizontal range that you selected. The
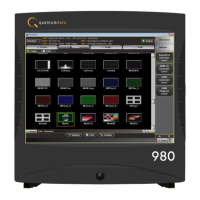
midpoint of the selection will become the new center of the data displayed. The two screens below show an
example of surrounding a segment of data. The dotted indicates the resultant section that is surrounded. The
second view shows the resulting view.