ABL800 FLEX Reference Manual 3. Optical measuring principles
Optical system, Continued
Continuous
spectrum
n
A
λ
total
can be depicted graphically as a function of wavelength, and if the
differences between the wavelengths are small enough, a continuous spectrum is
produced.
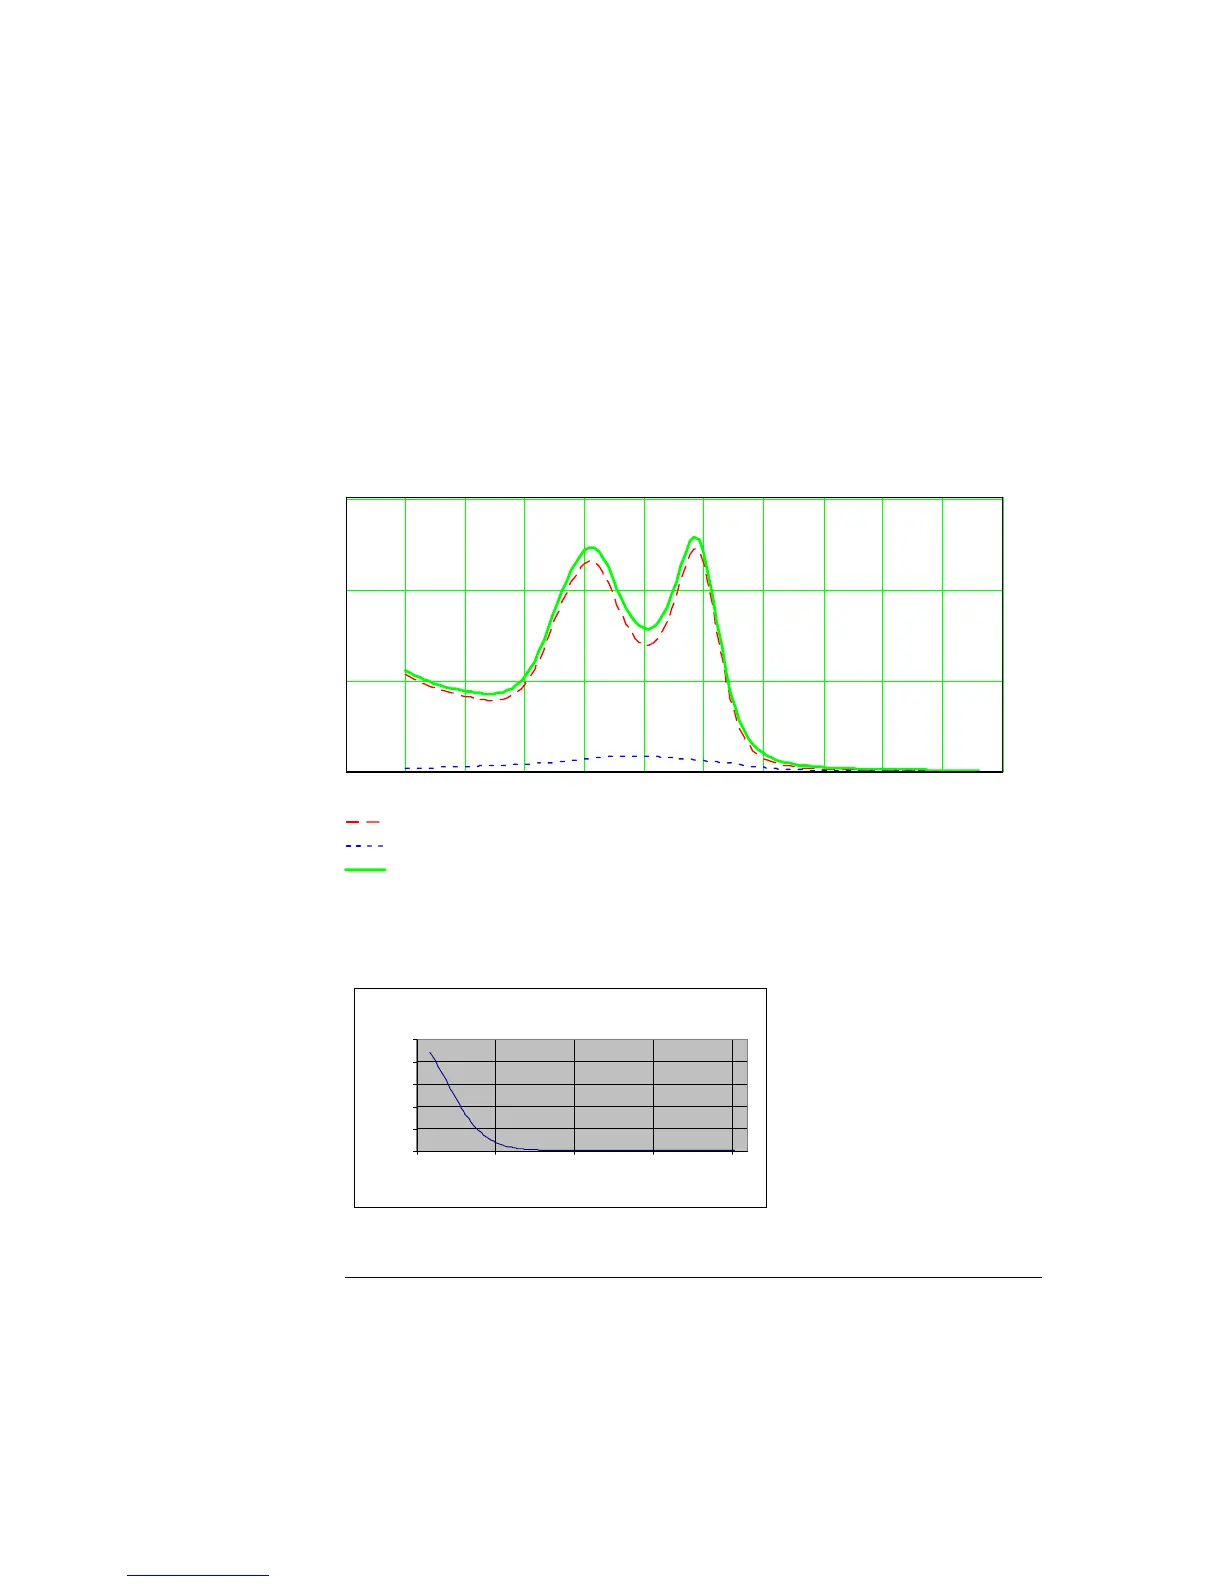
EXAMPLES:
The figure below shows three spectra; pure O
2
Hb, pure HHb in a low
concentration, a spectrum of 92 % oxygenated hemoglobin obtained by adding the
spectra of O
2
Hb and HHb. The additivity of absorption and the continuity of the
spectra can clearly be seen.
480
500
520
540
560
580
600
620
640
660
680
O
2
Hb (9.2 mmol/L)
HHb (0.8 mmol/L)
92 % oxygenated hemoglobin (i.e., 92 % O
2
Hb + 8 % HHb)
Wavelength/nm
Absorption
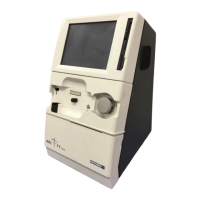
Example of the spectrum obtained from unconjugated bilirubin at concentration of
200
µmol/L.
200umol/L Unconjugated Bilirubin in Plasma
0
0.02
0.04
0.06
0.08
0.1
470 520 570 620 670
nm
Absorbance
The spectrum of conjugated bilirubin is slightly different.
Continued on next page
3-5