ABL800 FLEX Reference Manual 5. Performance characteristics
Performance test results – chart description
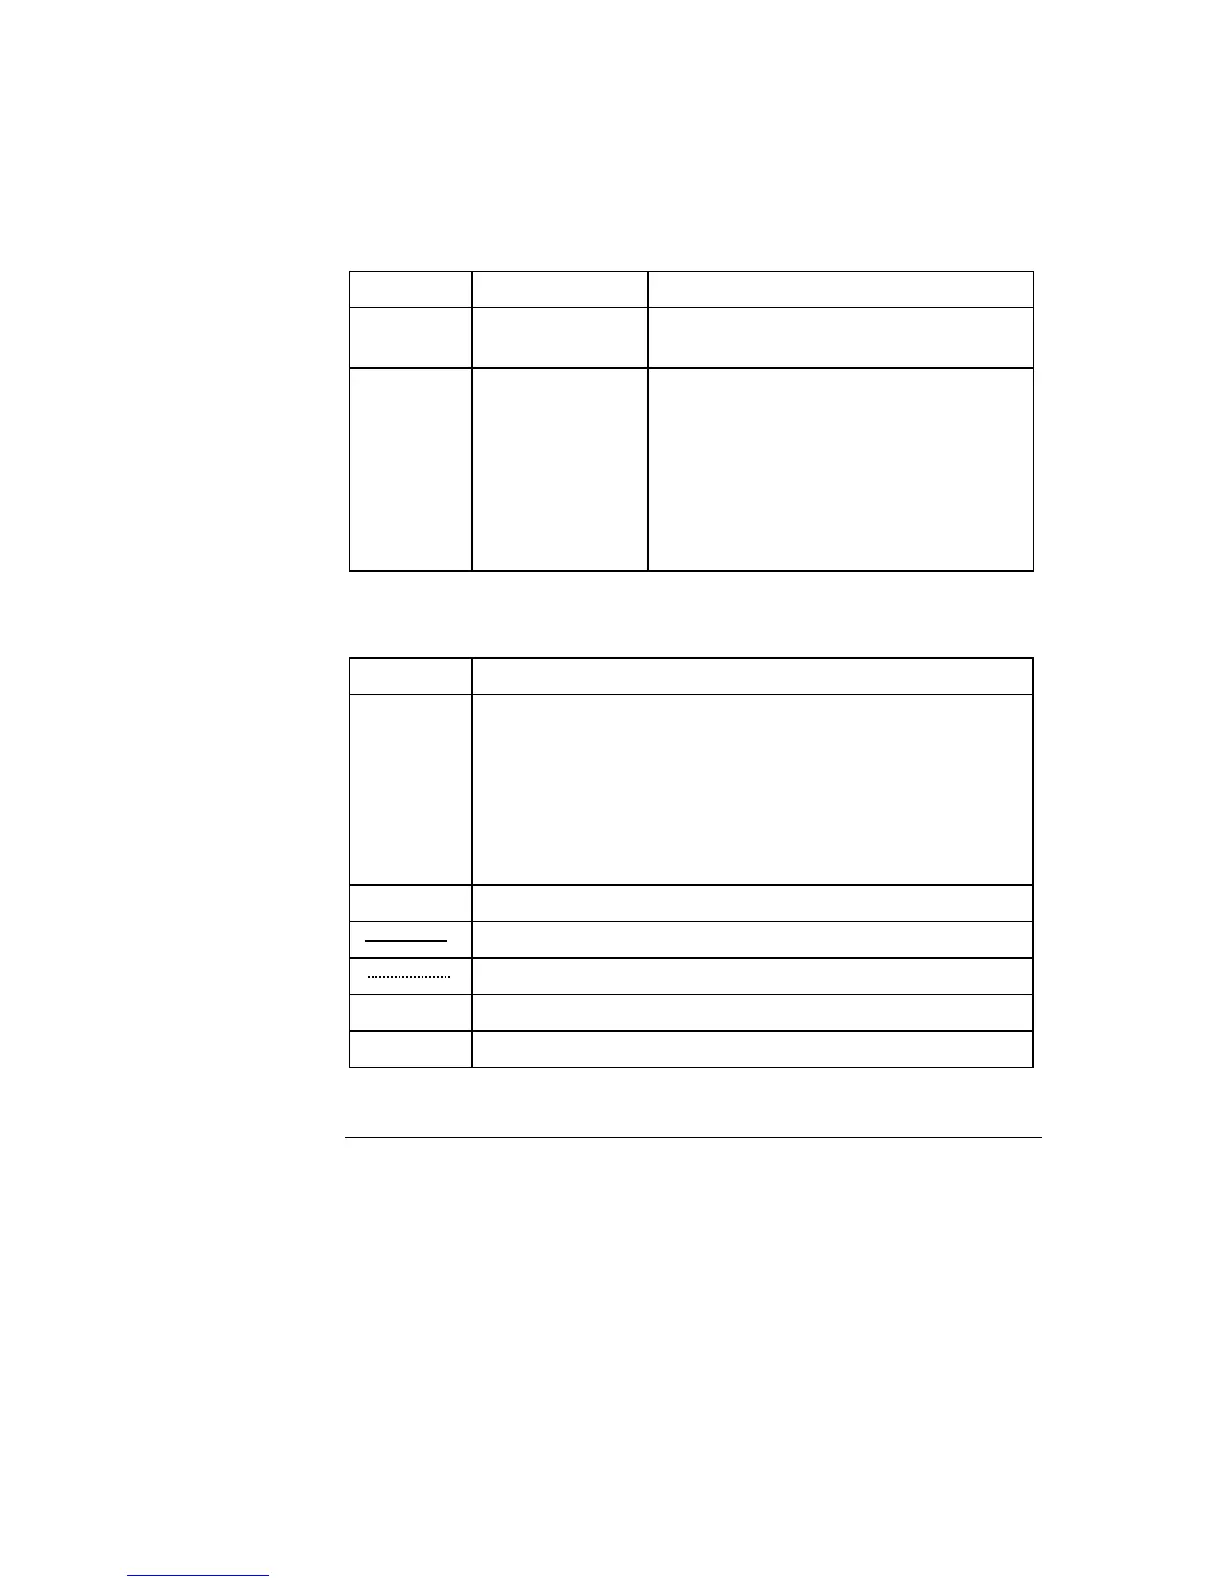
Modes
Tests were performed in the following modes:
Mode Syringe Capillary
Macro S195, S165 FLEXMODE ABL835 (no message)
FLEXMODE ABL805 (no message)
Micro S95, S85 C95, C85, C55, C35 OXI, C35 MET;
FLEXMODE ABL830 (no message)
FLEXMODE (message 869)
FLEXMODE (message 870)
FLEXMODE (message 871)
FLEXMODE (message 872)
FLEXMODE (message 873)
FLEXMODE (message 874)
Bias
ABL
chart
description
The legend of Bias
ABL
chart is given below:
Chart Description
x - axis The ABL735 mean values obtained as follows:
To determine the best possible ABL735 reference value for each
parameter of a specific sample, the measurements on 5 ABL735
are plotted as a function of time. A regression line is made to
represent the best possible mean ABL735 measurement at a
given time thus compensating the metabolism of the sample
during repeated measurements on it.
y - axis Bias in %; bias for pH in pH units.
95 % statistical confidence range for bias in macromodes.
95 % statistical confidence range for bias in micromodes.
N
macro
Number of measurements in macromodes.
N
micro
Number of measurements in micromodes.
Continued on next page
5-5