5. Performance characteristics ABL800 FLEX Reference Manual
Performance test results – chart description, Continued
Repeatability
chart
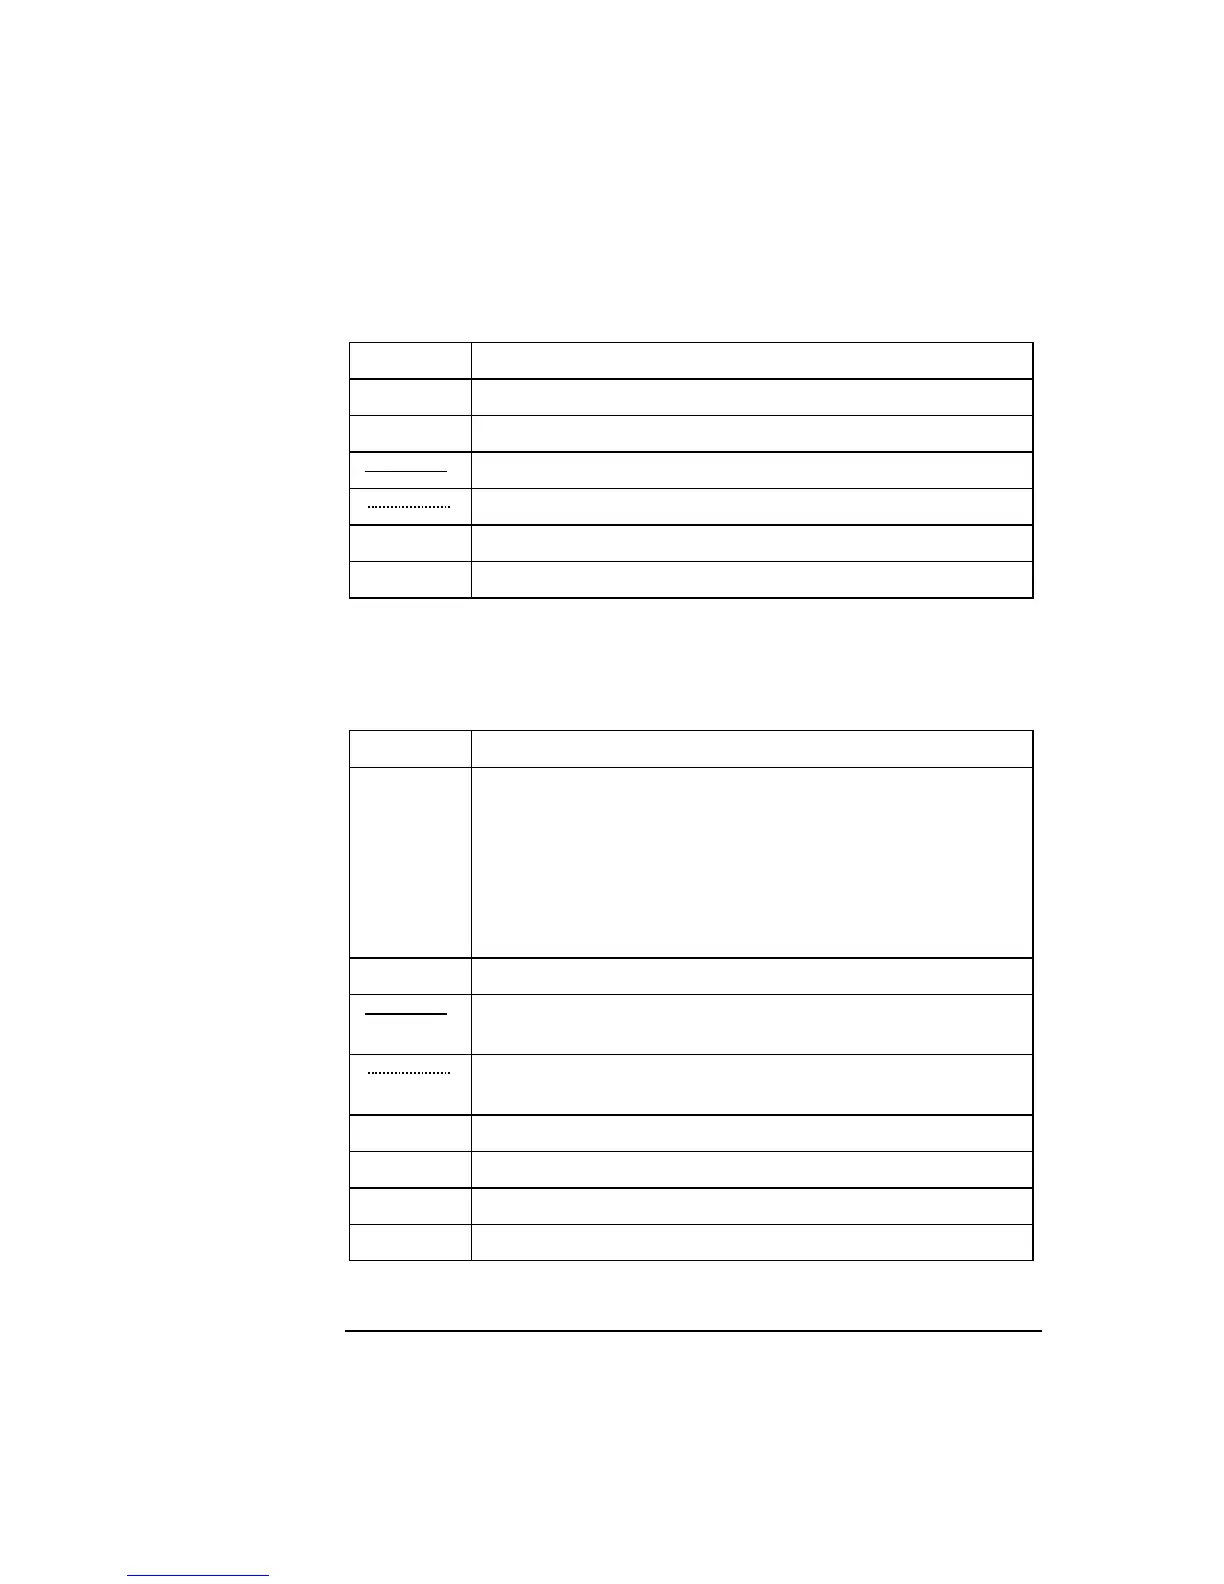
Repeatability is presented as a plot of the coefficient of variation (CV %).
Contribution to variation, such as sample matrix and environmental conditions, are
not directly included, but compensated for by extending the repeatability values
shown in the chart.
Chart Description
x - axis The ABL800 FLEX mean value.
y - axis Repeatability in %; repeatability for pH in pH units.
Repeatability in macromodes.
Repeatability in micromodes.
N
macro
Number of measurements in macromodes.
N
micro
Number of measurements in micromodes.
Total variation
chart
Total variation chart is presented as a difference plot against the regression line at
5 ABL735. The individual measurements are plotted directly.
Chart Description
x - axis The ABL735 mean values obtained as follows:
To determine the best possible ABL735 reference value for each
parameter of a specific sample, the measurements on 5 ABL735
are plotted as a function of time. A regression line is made to
represent the best possible mean ABL735 measurement at a given
time thus compensating the metabolism of the sample during
repeated measurements on it.
y - axis Total variation in %; total variation for pH in pH units.
At least 95 % statistical confidence range for total variation in
macromodes.
At least 95 % statistical confidence range for total variation in
micromodes.
o
Observations in macro-mode
x
Observation in micro-mode
N
macro
Number of measurements in macromode – see the next page.
N
micro
Number of measurements in micromode – see the next page.
Continued on next page
5-6
 Loading...