Chapter 2 - TECHNICAL INFORMATION
RC GROUP S.p.A I_TRP_0909_GB
14
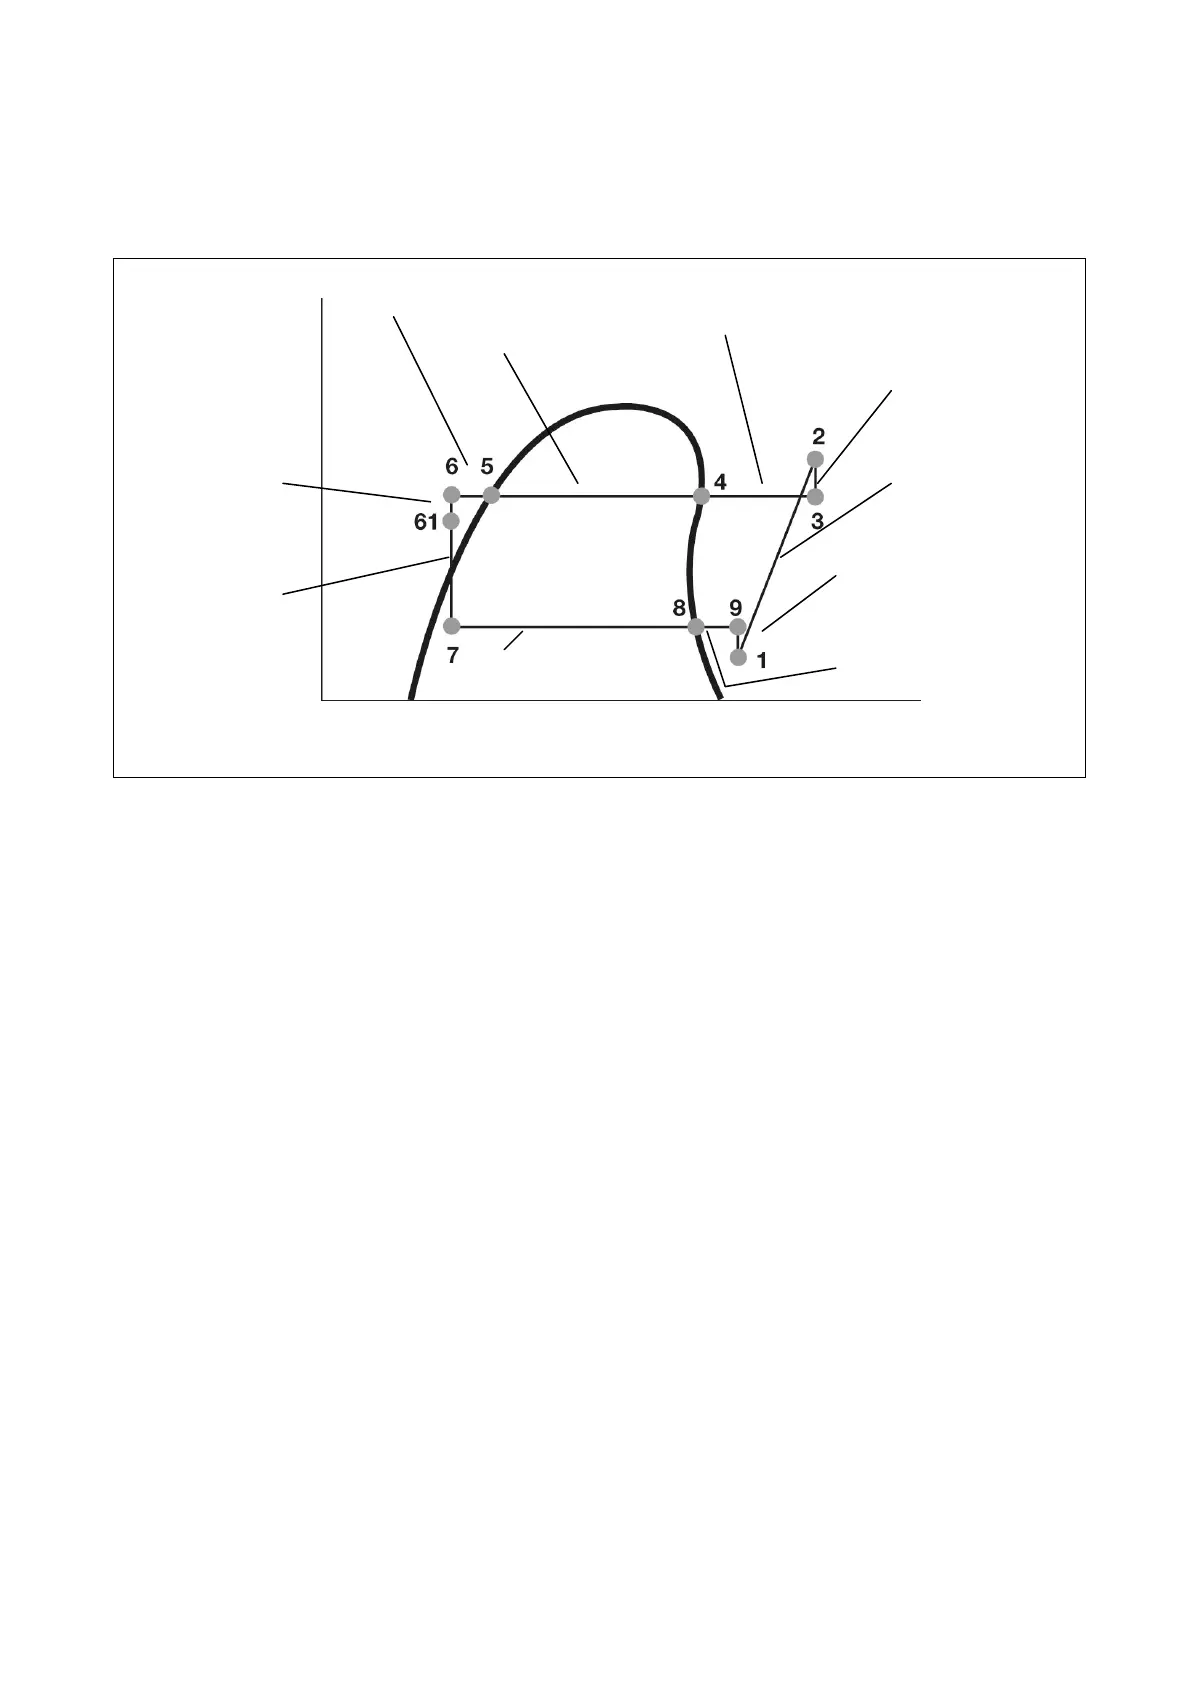
The graph shows the variations in the refrigerant’ pressure and
enthalpy during the entire thermodynamic cycle.
- from point (8) to point (4) the refrigerant is in the vapour phase
- from point (4) to point (5) the refrigerant is reduced from its vapour
phase to its liquid phase
- from point (5) to point (7) the refrigerant is in the liquid phase
- from point (7) to point (8) the refrigerant is reduced from its liquid
phase to its vapour phase
5/6 cooling
4/5 condensation
6-6
1
drops
6
1
-7
expansion
8-9 overheating
7-8 evaporation
3-4 de-superheating
2-3 discharge
line pressure
drops
1-2
compression
9-1 suction line
pressure drops
ENTHALPY
 Loading...