28/74
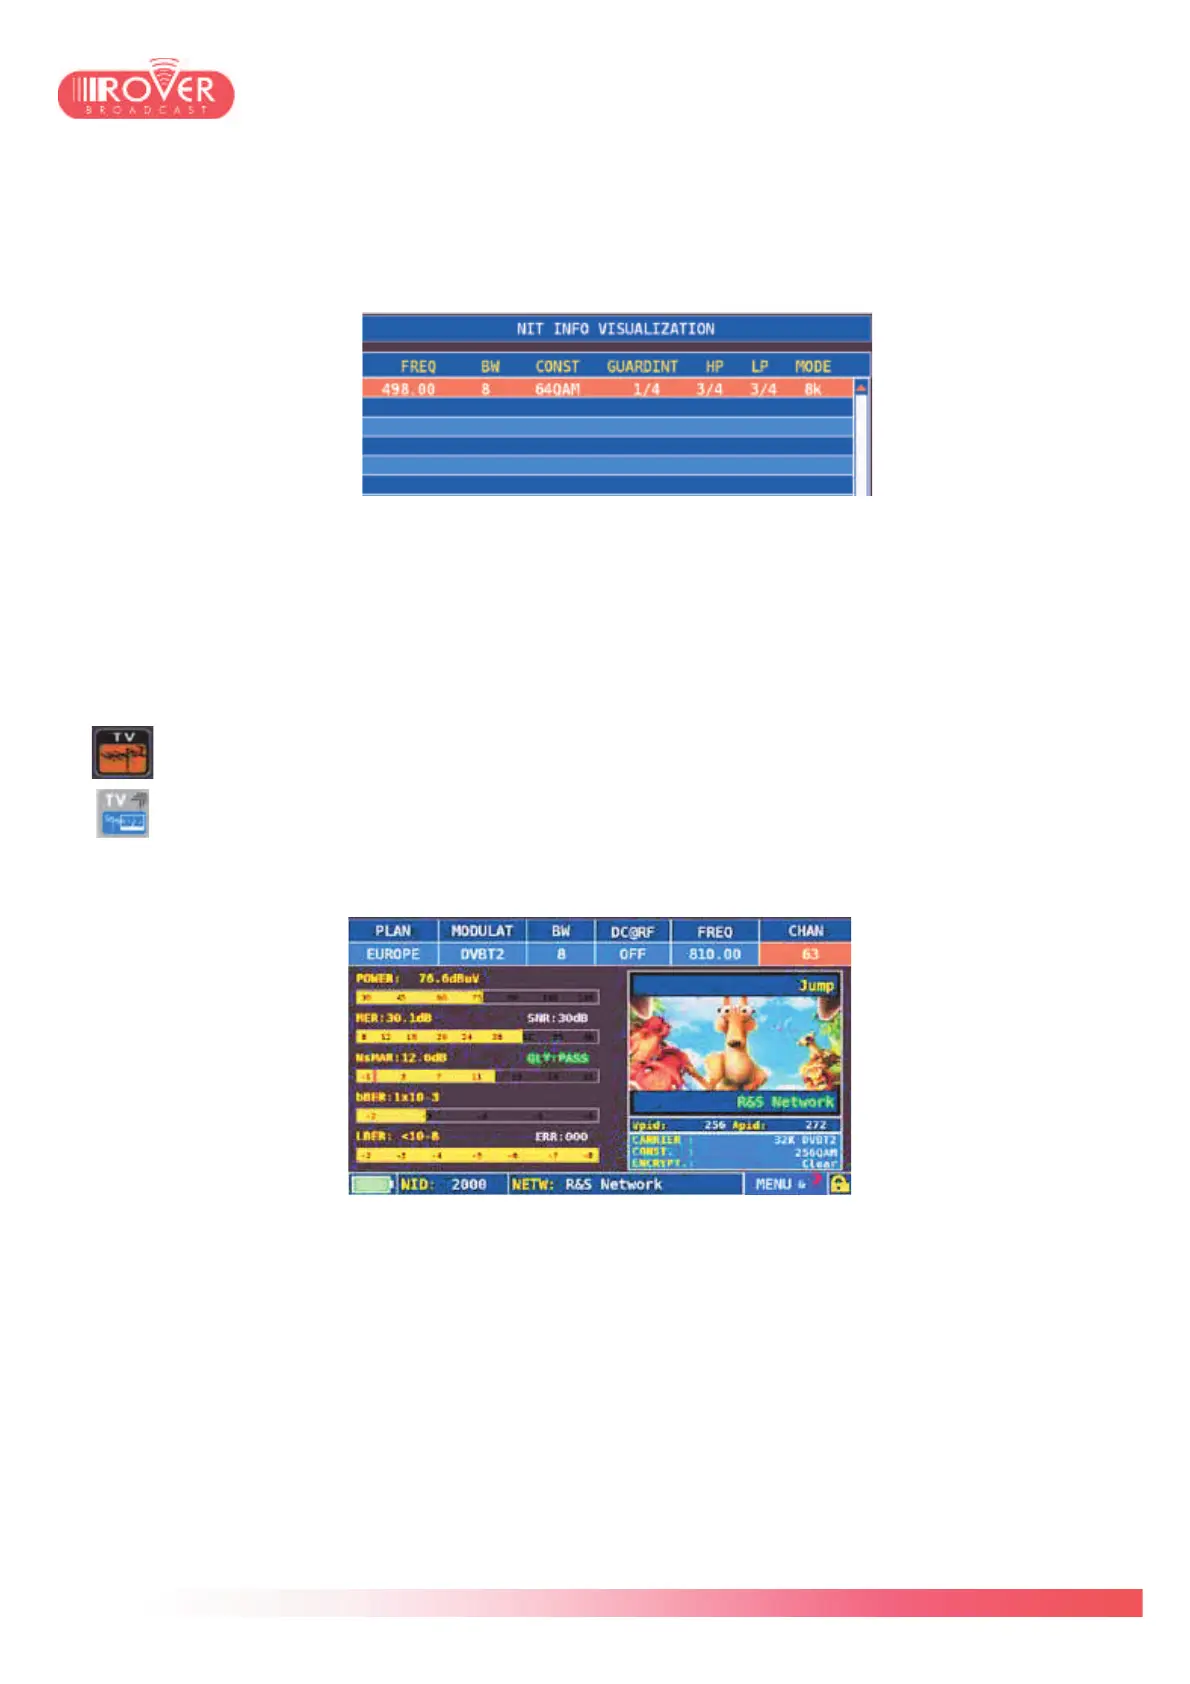
The NIT visualization function allows the user to decode and visualize the content of the NIT
table carried by the demodulated Satellite signal. The screen is dynamically filled with the
decoded information, including: frequency, BW, constellation, etc, as shown in the next
picture:
6.3 Performing Digital TV measurements
The basic principle of the terrestrial measurement interface is very similar to what has
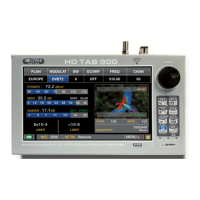
been described for the satellite. From the HOME page, the user should touch the
screen over the TV icon or press the TV button on the keyboard.
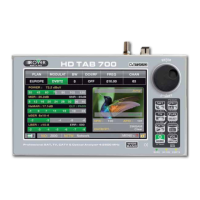
After having selected the basic canalization plan to be used, the terrestrial
measurement interface appears:
The terrestrial measurement interface is composed by four screens. In the first screen the
basic measurement parameters are displayed. At the top of the screen the user can find the
channel tuning parameters: Modulation type, Channel bandwidth, frequency and channel
number. In case the signal is received through a centralized distribution system needing a
specific power supply, the meter is capable to bias it, providing at RF input (F connector) a DC
voltage variable between 5 and 24V. The voltage value is configurable via the DC@RF
parameter.
On the left side, similarly to what has been shown for the satellite measurement interface, the
meter shows the main RF measurements: RF level, MER and Noise Margin, bBER and
aBER/LBER.