46/74
Bar and Tilt Graph
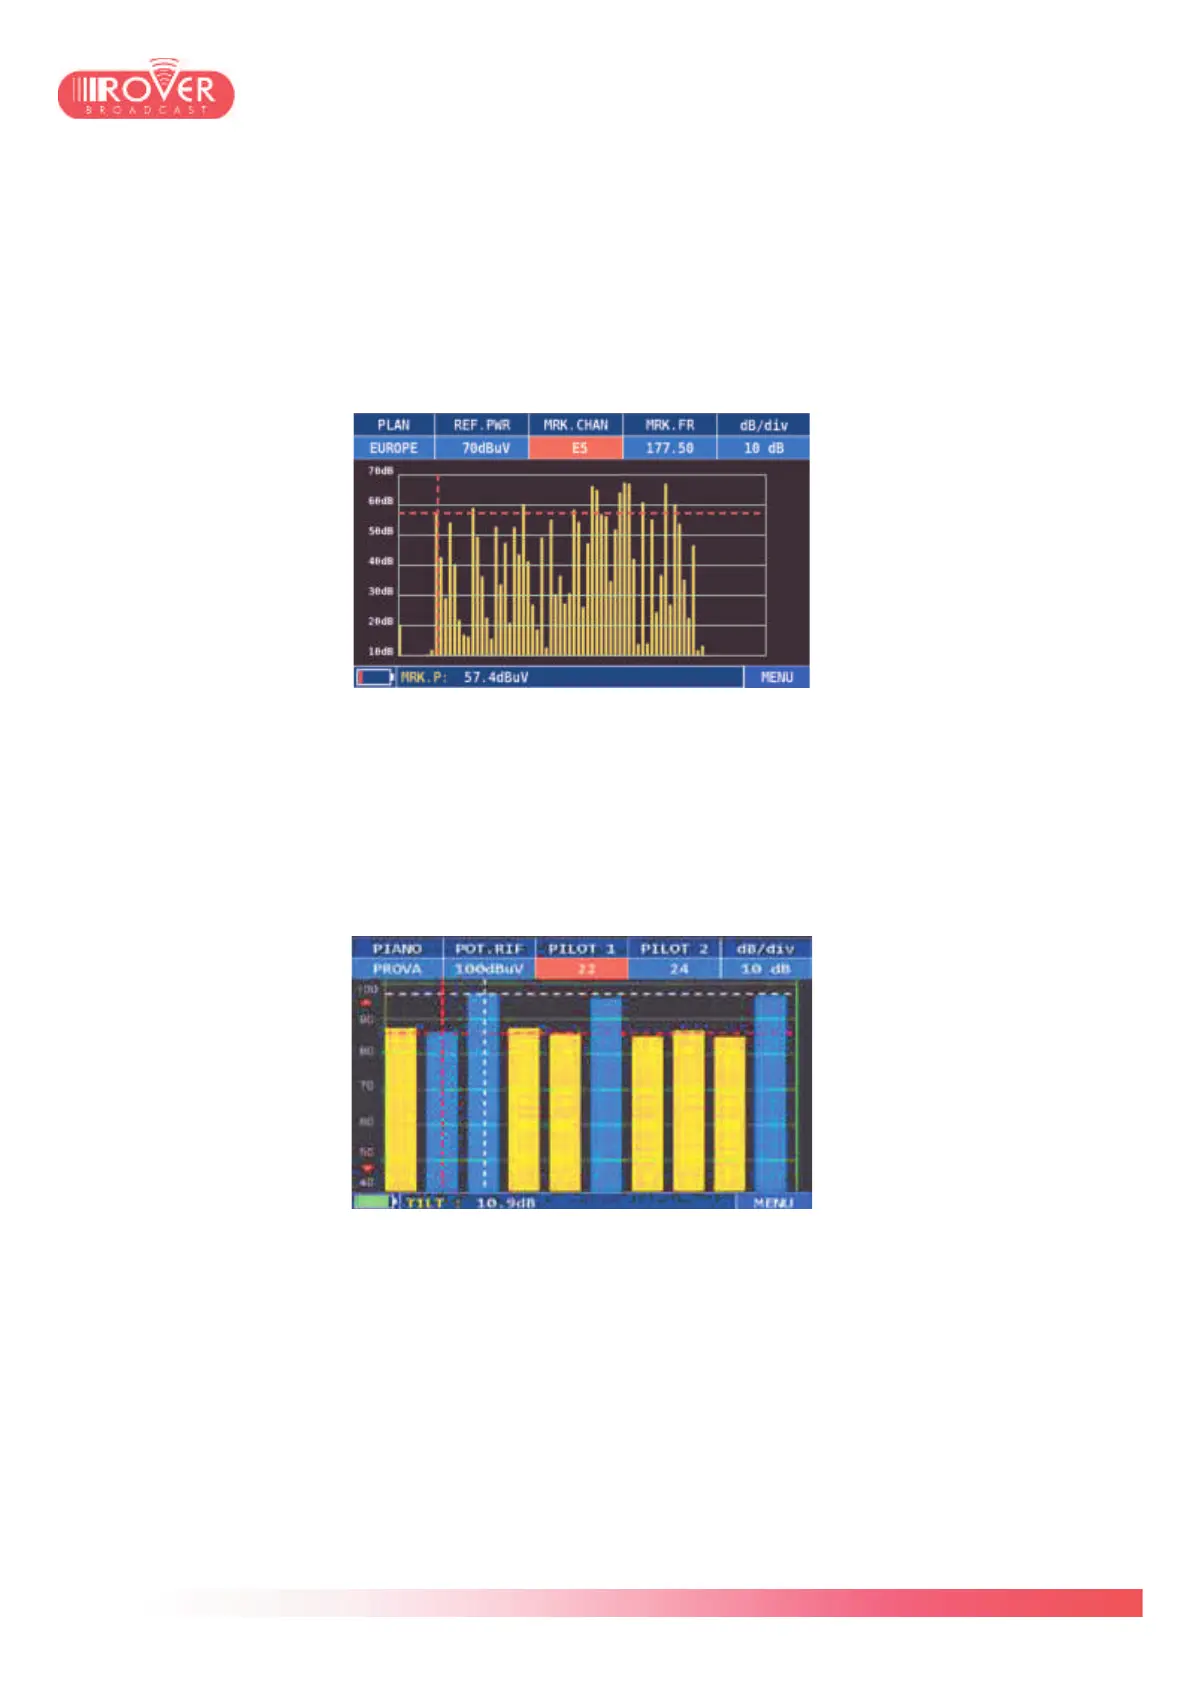
10.1 Basic functions of the BAR GRAPH
The HD PRO TAB provides the Bar Graph and Tilt Graph representations of the band. With the
Bar Graph the user can visualize all the channels detected by the meter based on the pre-
selected canalization:
Moving the marker over the different bars, the meter will give its power level in the bottom
status bar, with the parameter MRK P (Marker Power).
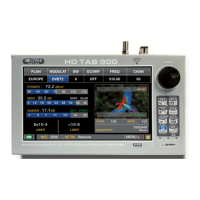
Via the contextual MENU is possible to toggle the view to the TILT Graph. This graph is often
use to determine the power distribution along the monitored band, taking a certain number of
carriers as reference and evaluating the average power level as well as the relative difference
between two carriers.
Moving the PILOT 1 and PILOT 2 markers, is possible to set the carriers on which the
differential power measurement is performed; in the bottom status bar, the meter gives the TILT
value (power level difference).
As the meter is able to identify both analog and digital channels, both the BAR Graph and the
TILT Graph can be done on mixed channel plans, containing analog and digital carriers (as
shown in the TILT graph above). For the analog channels, the reference power level is the one
of the Video Carrier.