39/74
HD PRO TAB Spectrum analyzer
8.1. Performing spectrum analysis
To access the spectrum analyzer from the meter’s home page the user should press the
SPECT button on the screen or the SPECT button on the keyboard.
The spectral analysis starts automatically on the canalization plan previously selected
or, if the user did SAT, TV or CATV measurements, on the last channel tuned by the
meter.
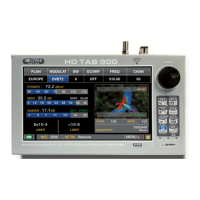
The top of the screen contains the tuning parameters and, in addition, the SPAN parameter
which gives the user the possibility to increase or decrease graph’s span around the measured
signal.
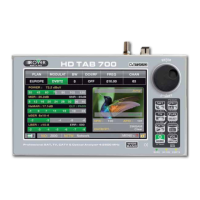
Beyond the classical SPANs (from 10 to 500MHz for satellite signals; fro 1 to 500 MHz for
terrestrial signals) shown here under
TER Span SAT Span
is also possible to make special SPAN selections to visualize SAT extended spectrum*. Two
modes are available:
- “>2250M” which visualizes the signals in the band exceeding the 2250MHz
- “Extended” which visualizes the full extended band, from 950 to 2750MHz
(*This function requires a specific APP. Contact us for availability and upgrade information).