32/74
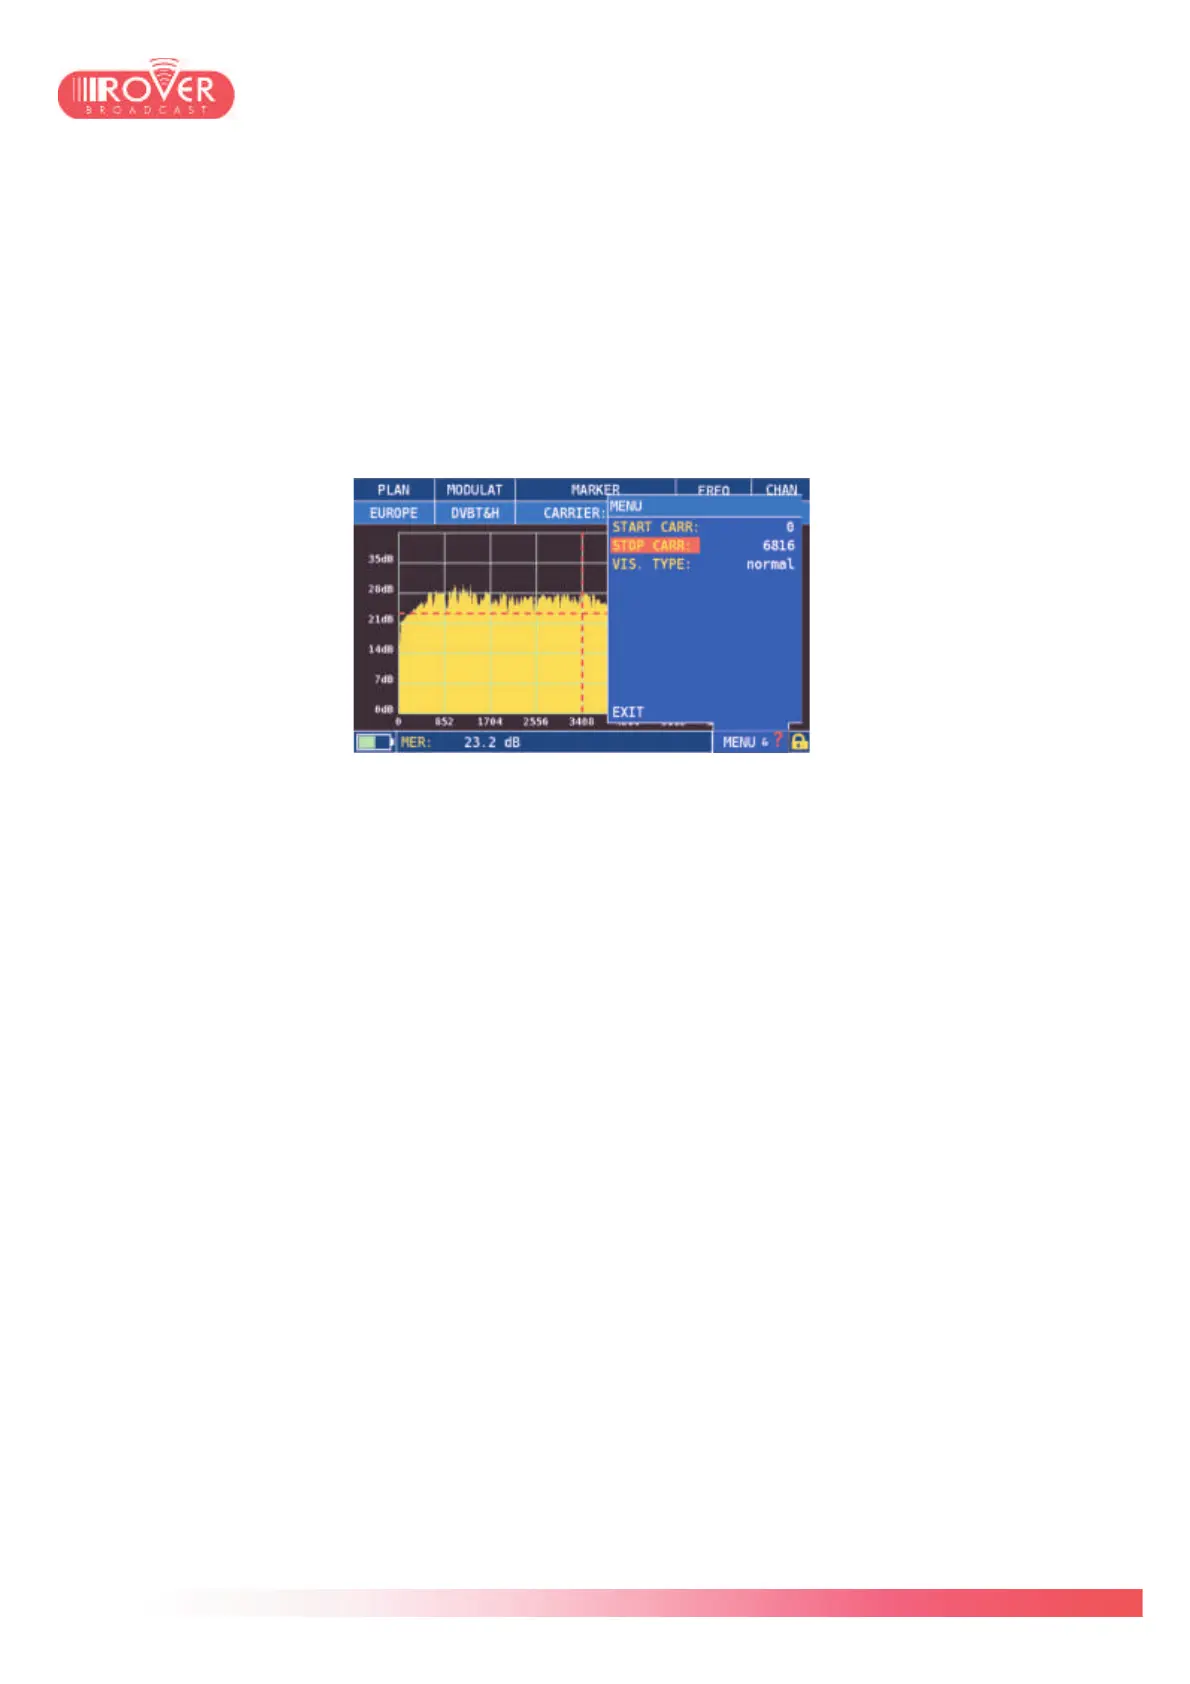
The marker can be moved along the signal envelop: at the top of the screen, the CARRIER
field indicates the carrier number and at the bottom is displayed the MER value of the selected
carrier.
By default the graph visualize all signal carriers which, depending on the mode, could be 2000
or 8000 for DVB-T, or 32000 for DVB-T2 signals; the marker is by default positioned at the
center of the envelop.
Using the “MENU&?” contextual menu, the user can select the number of carriers to be
displayed, specifying from which carrier to start to plot and at which carrier to stop. In this menu
is also possible to visualize the graph in normal spectrum view or reverse spectrum view.
Similarly to what has been described for the SAT measurements, also for Terrestrial
measurement is possible to access via the contextual menu the Channel logger and the NIT
visualization functions.