EN-39Manual | TM3-Primus 4 | Instruments | 4.2 | Chart
EN
4.2 | Chart
Instrument
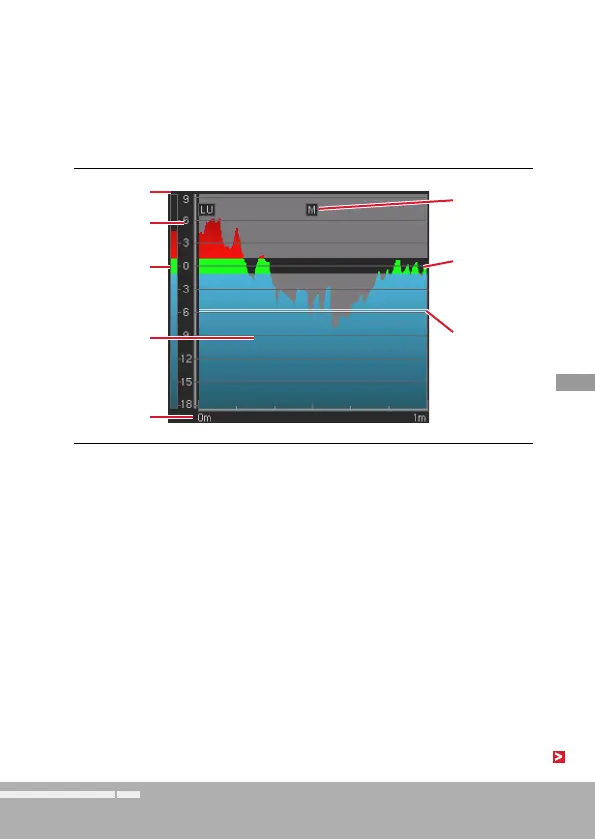
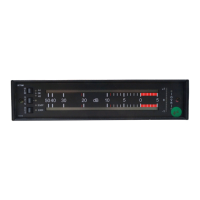
The Loudness Chart instrument displays the progress of a measurement
(TP, M, S, or I value over time) as line or colored area under curve on a
coordinate system with selectable time range. Additionally, the tolerance
range can be displayed as a kind of corridor. A dynamic line shows the
position of the Relative Gate in relation to the I value, and an additional
bargraph for the display of the current I loudness value can be selected.
In the combination of the example you can easily read that the I value
(bargraph on the left) is exceeding the target value and the M value
loudness leaps (graph over time). You can also estimate the parts which
currently have been excluded from the measurement by the Relative Gate
(parts below doubled line and above graph). The program shown in the
example should be reduced to get the I value into the green range.
After its selection, the instrument will be displayed in the upper half of the
screen.
Tolerance set
of the Target
Level
Selected
Loudness
value
I bargraph
Time range
Current
position of
Relative Gate
in relation to
I value
Graphical
presentation
of the course
over time
Example:
LU scale
Adjustable&
marked
Tolerance
range