Chapter 5 Data Display
32
Chapter 5 Data Display
5.
5.1 Navigating in the Display Mode
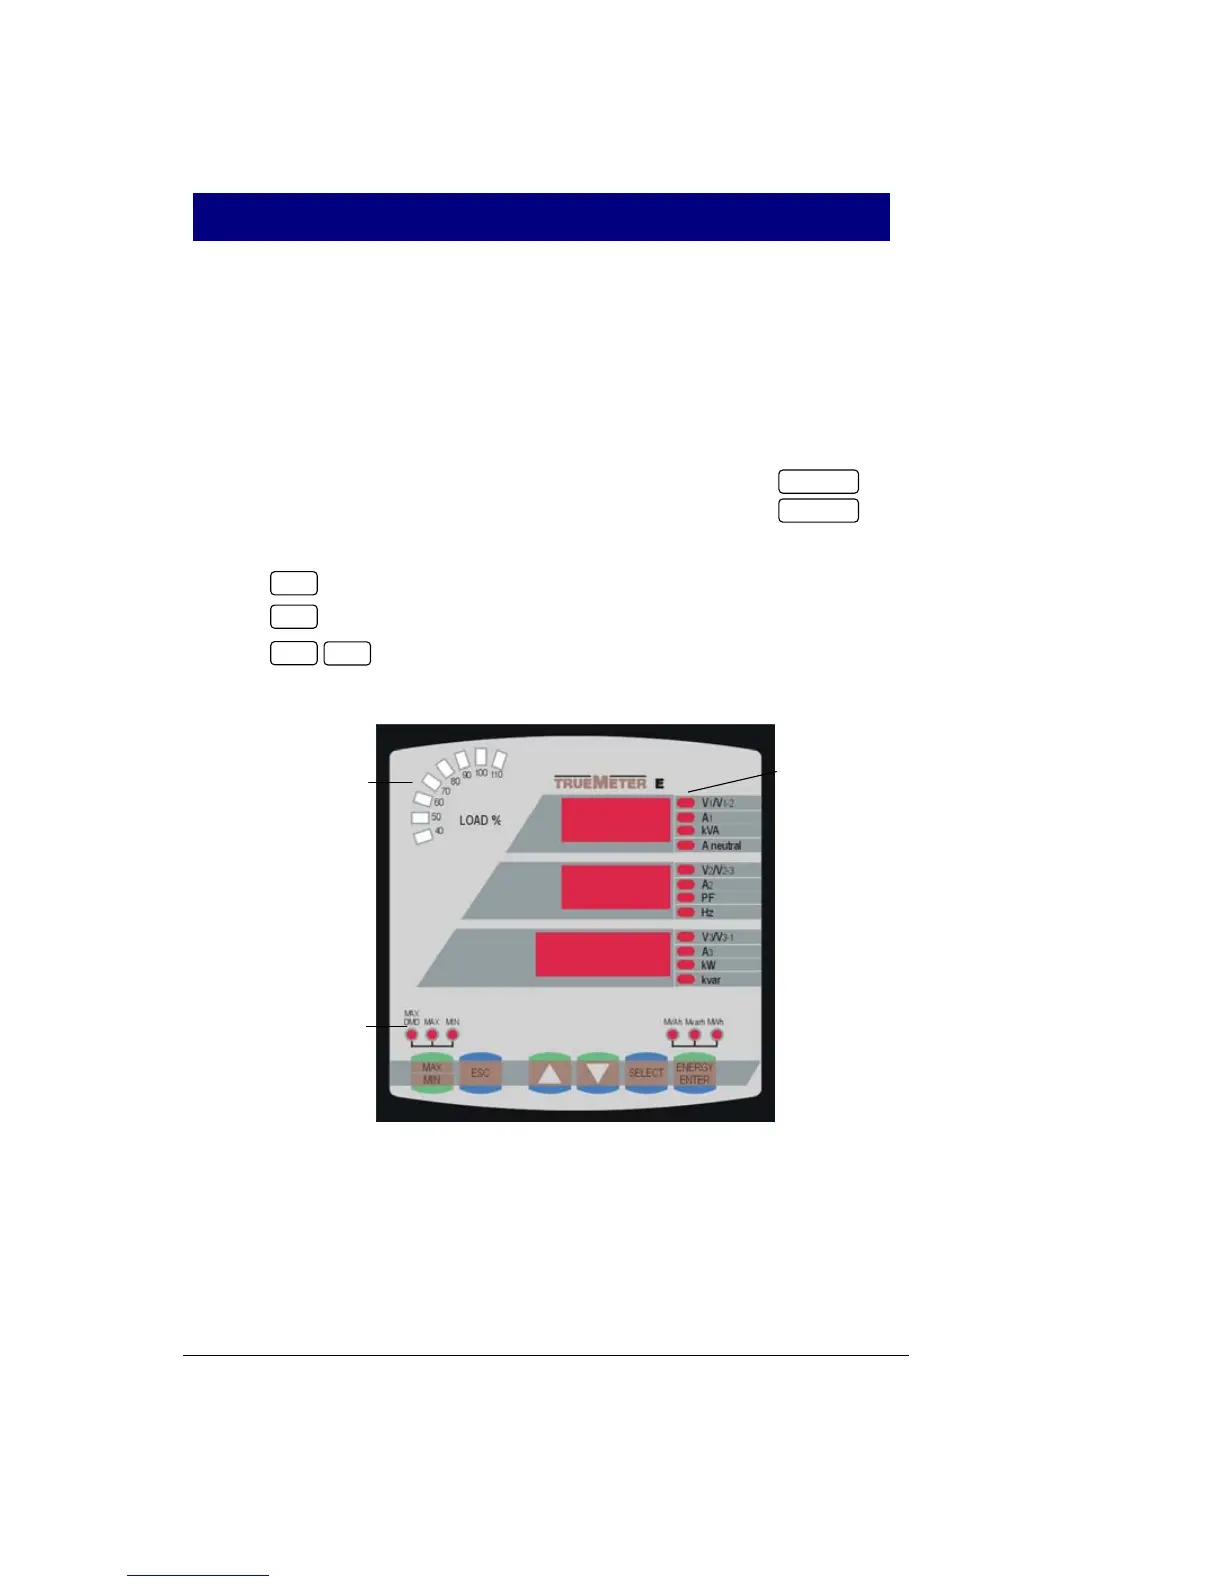
The front panel has a simple interface that allows you to display
numerous measurement parameters in up to 38 display pages. For
easier reading, the parameters are divided into three groups, each
accessible by a designated key. These are:
Common measurements
- no selection key
Min/Max measurements
- selected by the key
Energy measurements
- selected by the key
The up/down arrow keys are used as follows in the Display Mode:
Scrolls through the pages downward (forward)
Scrolls through the pages upward (backward)
Returns to the first page within current measurement group
For each display page, up to three parameters can be displayed.
The Load bar graph displays the amount, in percent, of the current
load with respect to user-defined nominal load current. The highest
current measured by the PM130 is divided by the nominal load
current as defined in the Display Setup Menu (see Section 4.6)
and expressed as a percent by the LEDs (40% to 110%) which are
lit. For example, if all LEDs up to and including 90% are lit, this
means that the load is 90%-100% of the nominal load current. If
the nominal load current is set to 0, the CT primary current setup is
used.
MAX/MIN
ENERG