52
SBS-6500 User Manual
Storage Battery Systems, LLC.
9. Data – Curve
9.1. Curve (Trend Curve Analysis)
Impedance and voltage measurement data for a cell are displayed in curved line which
allows you to observe the trend of the changes over the history of a cell.
The impedance, voltage and temperature line thicknesses are displayed differently for easy
recognition between plot lines.
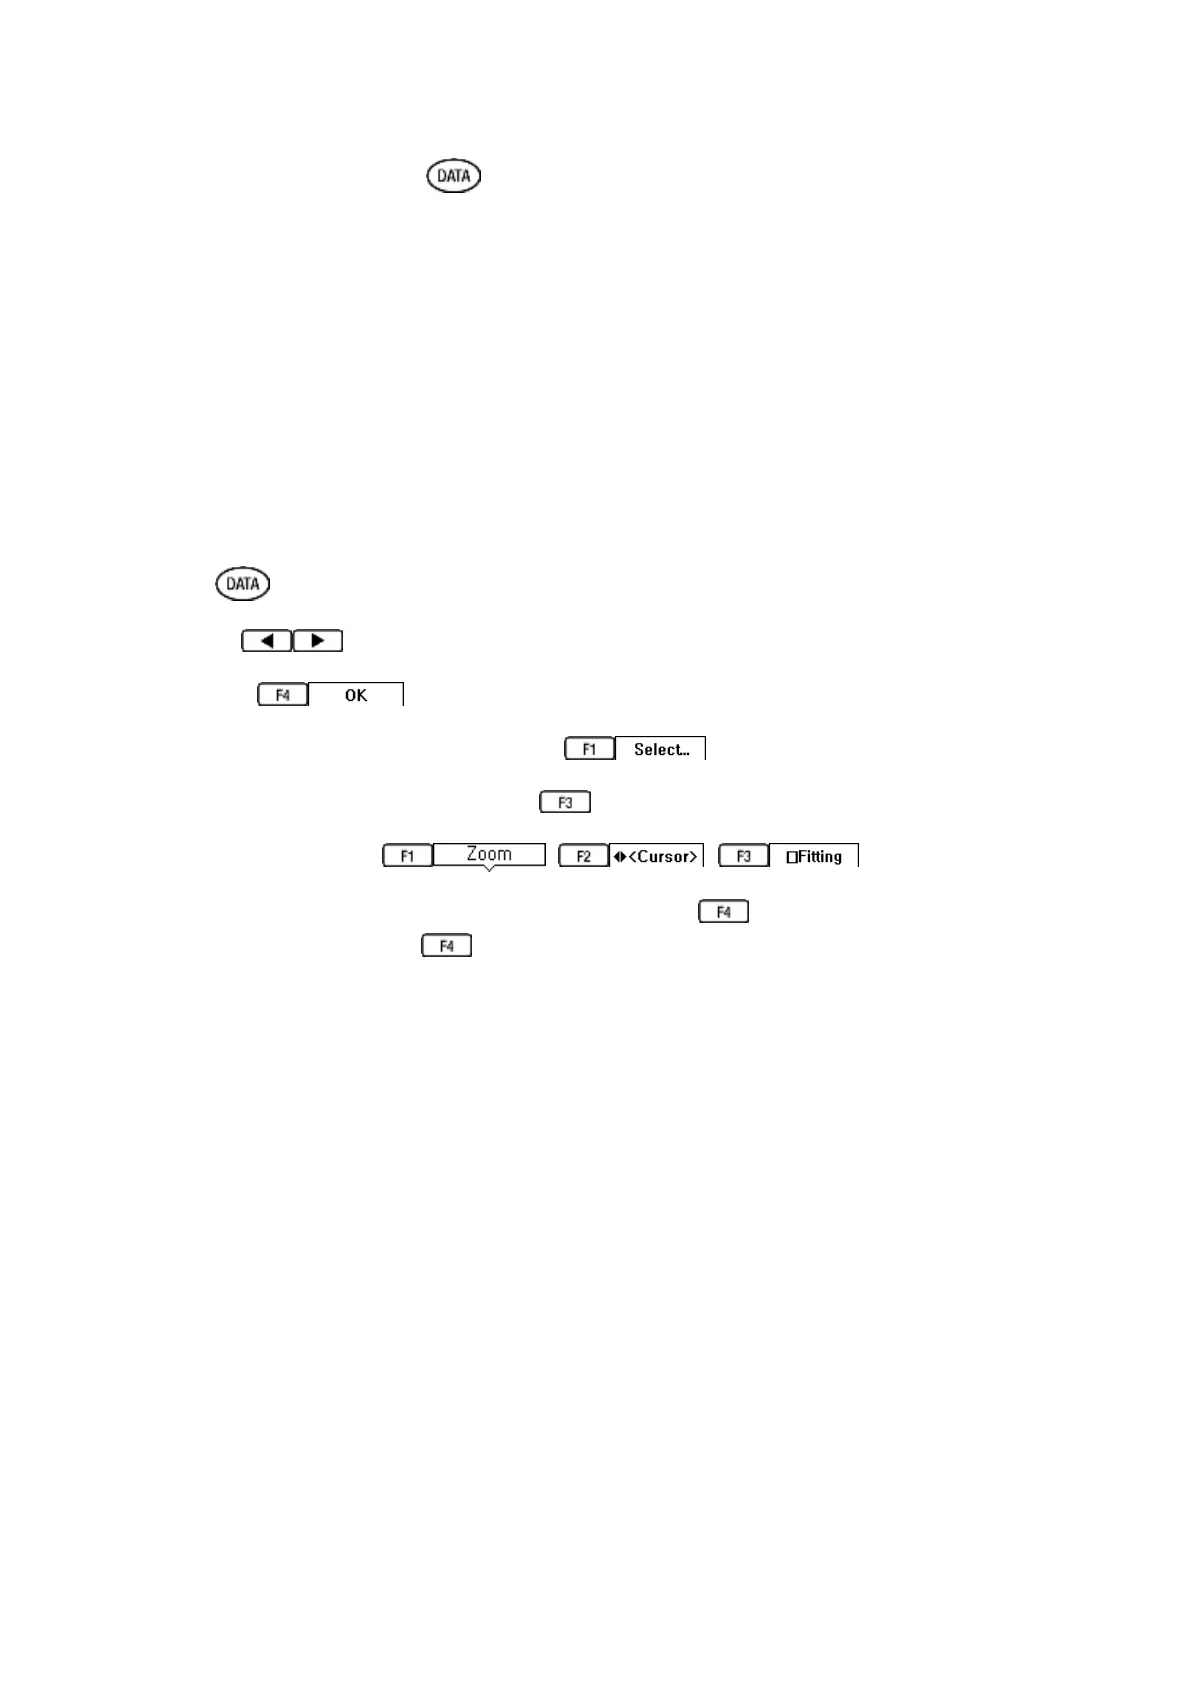
[Operation Procedure]
① Press key to enter data display screen.
② Use the keys to select curve.
③ Press the keys to enter.
④ Highlight the desired string and press STRING key.
⑤ Highlight the desired cell and press to enter curve mode.
⑥ Select soft key menu as needed.
⑦ To exit from curve mode to previous mode, press exit key to select another cell
or continue pressing the EXIT key to go back to the main data menu.
[Note]
The Number of plotting dots (displayed in a line) is a maximum 100 data points per cell.
Test Equipment Depot - 800.517.8431 - 99 Washington Street Melrose, MA 02176
TestEquipmentDepot.com