Schaeffler Technologies
BA 68
55
Acknowledge alarm notification
The [
Acknowledge notifications
] button takes the user to
the relevant screen. For further information on acknowleding alarms,
see page 50.
View KPIs and raw data
Tapping in one of the graphs displayed will show the values corre-
sponding to the tapped position under the x-axis. The time signal
and frequency spectrum of the raw data can also be displayed in
a separate magnified view using the [
Magnifier
] button,
Figure 36
.
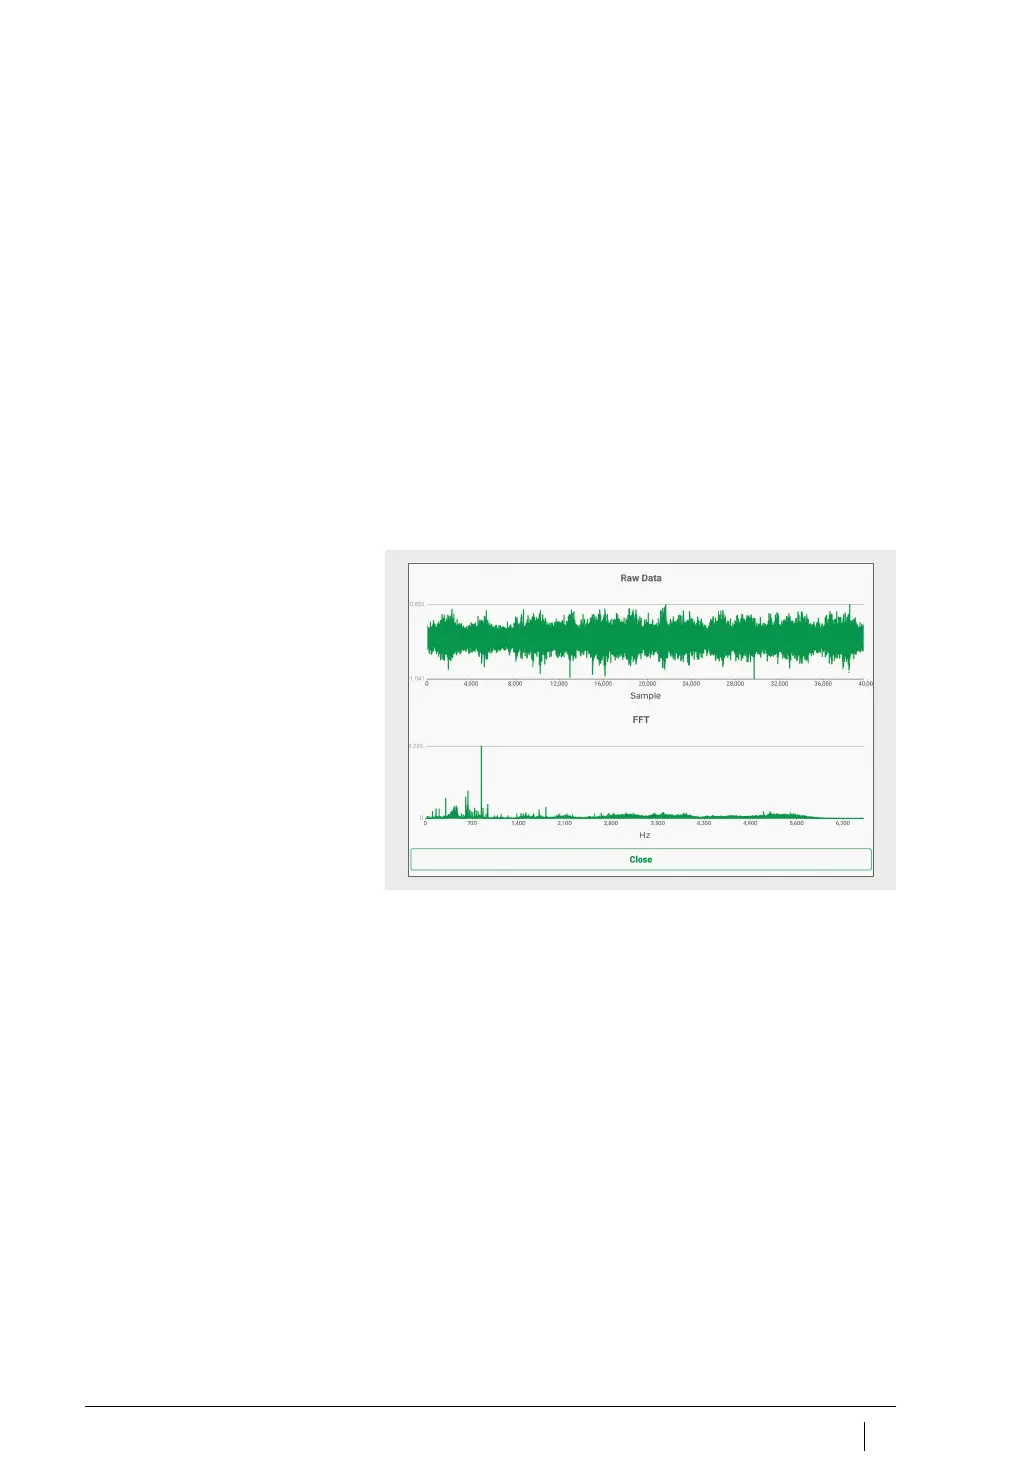
The magnified view of the raw data displays the time signal and
frequency range. Tap within the time signal to centre the point you
tapped in the view. You can also zoom into the time signal by placing
two fingers on the time signal and then spreading them apart.
Move one finger on the time signal to the left or right to move the
zoomed area. To zoom out place two fingers on the time signal and
then pinch close.
Do exactly the same to navigate the frequency range.
Use the [
Close
] button to return to the sensor management screen.
Figure 36
View raw data