3.4.1 Graphics area
FTAnalyzer uses special graphic view called Graphics area to display measures. These views are
mainly of two types and have different functions.
Graphics area for time domain analysis (oscilloscope)
This view can be used as an oscilloscope screen which displays the time trend of the analysed
measures.
Graphics area for frequency domain analysis (spectrum analyzer)
This view can be used as a spectrum analyzer screen which displays the Fast Fourier Transform
(FFT) of acquired measures. In these views, the FTAnalyzer applies the Fast Fourier Transform
to the acquisition signal and displays its frequency spectrum.
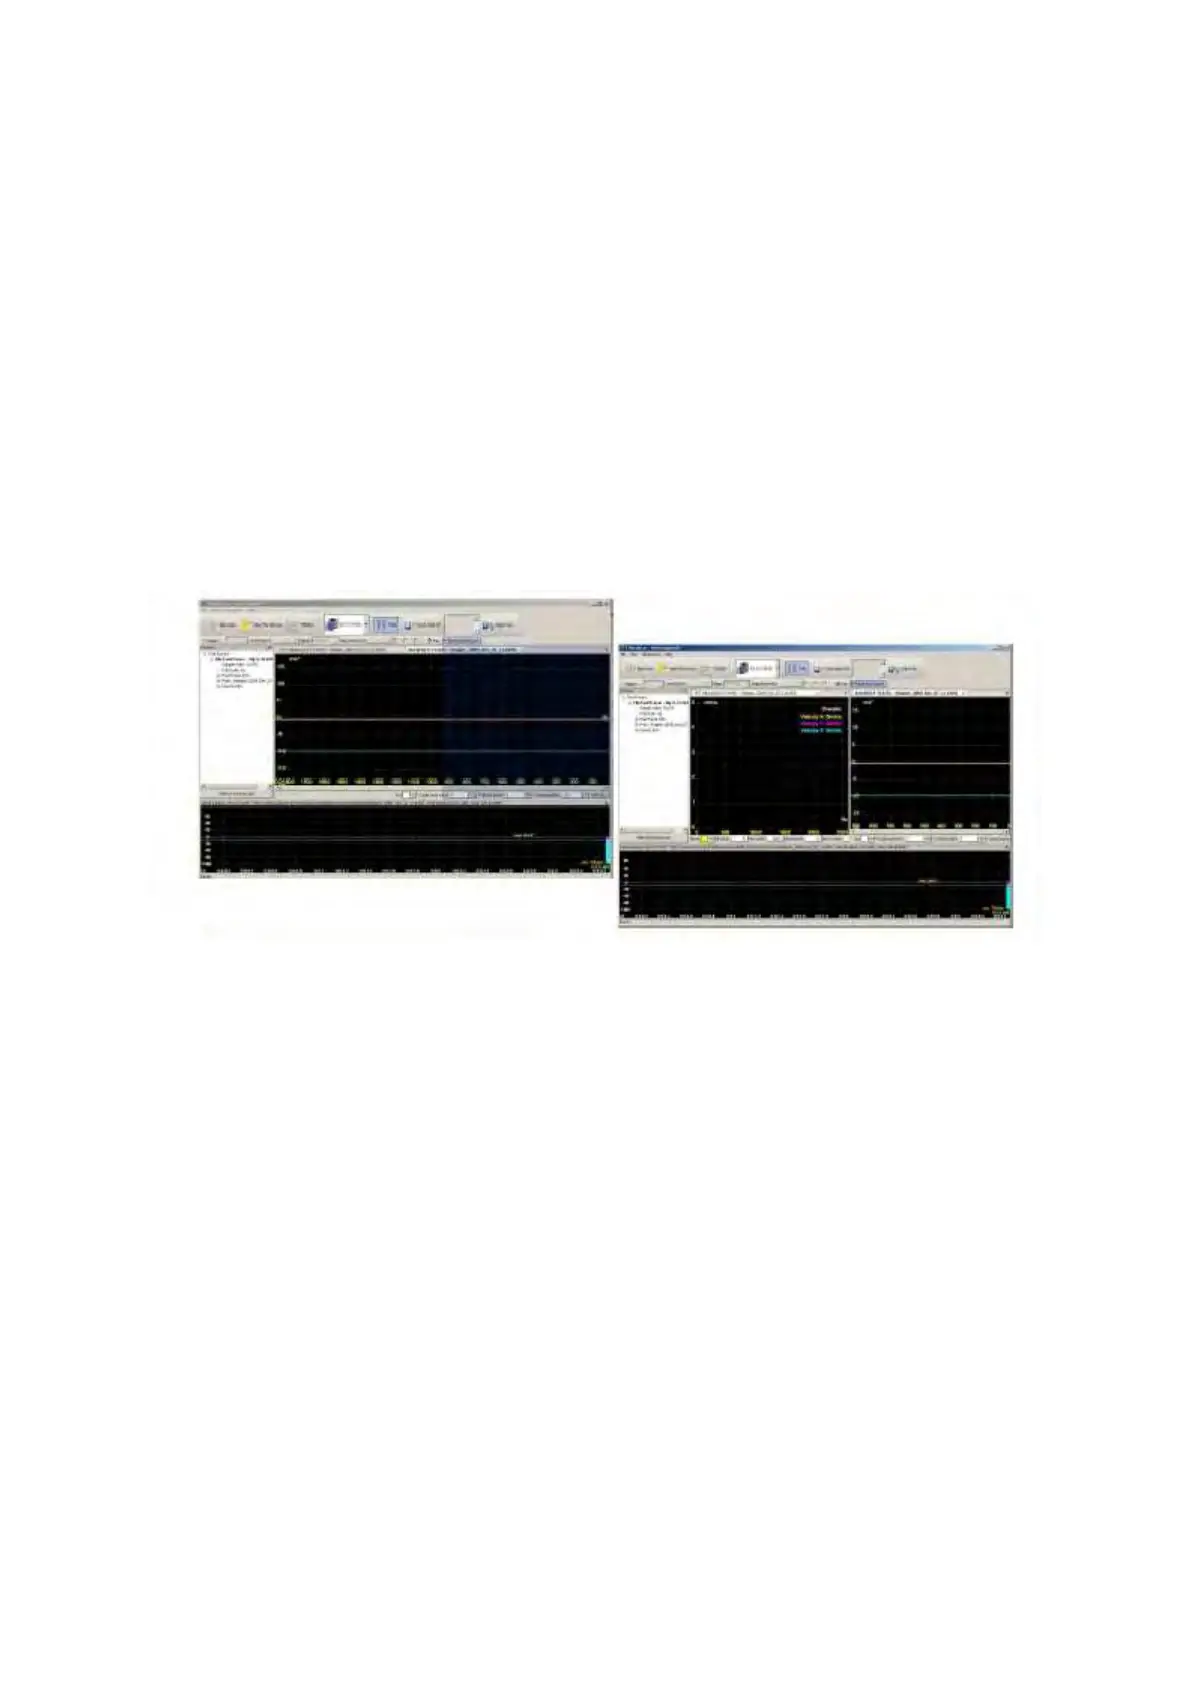
FTAnalyzer: different Graphics areas displayed in the active view
The FTAnalyzer can display different Graphics areas in the same screen view at the same time.
Proceed as follows to drag a Graphics area into the screen view:
• click the title label with the left mouse button and keep it pressed;
• drag the pointer to the external border centre of the area where you wish to position the
Graphics area. Please notice that the colour of the view part including the Graphics area is
blue;
• release the left mouse button.