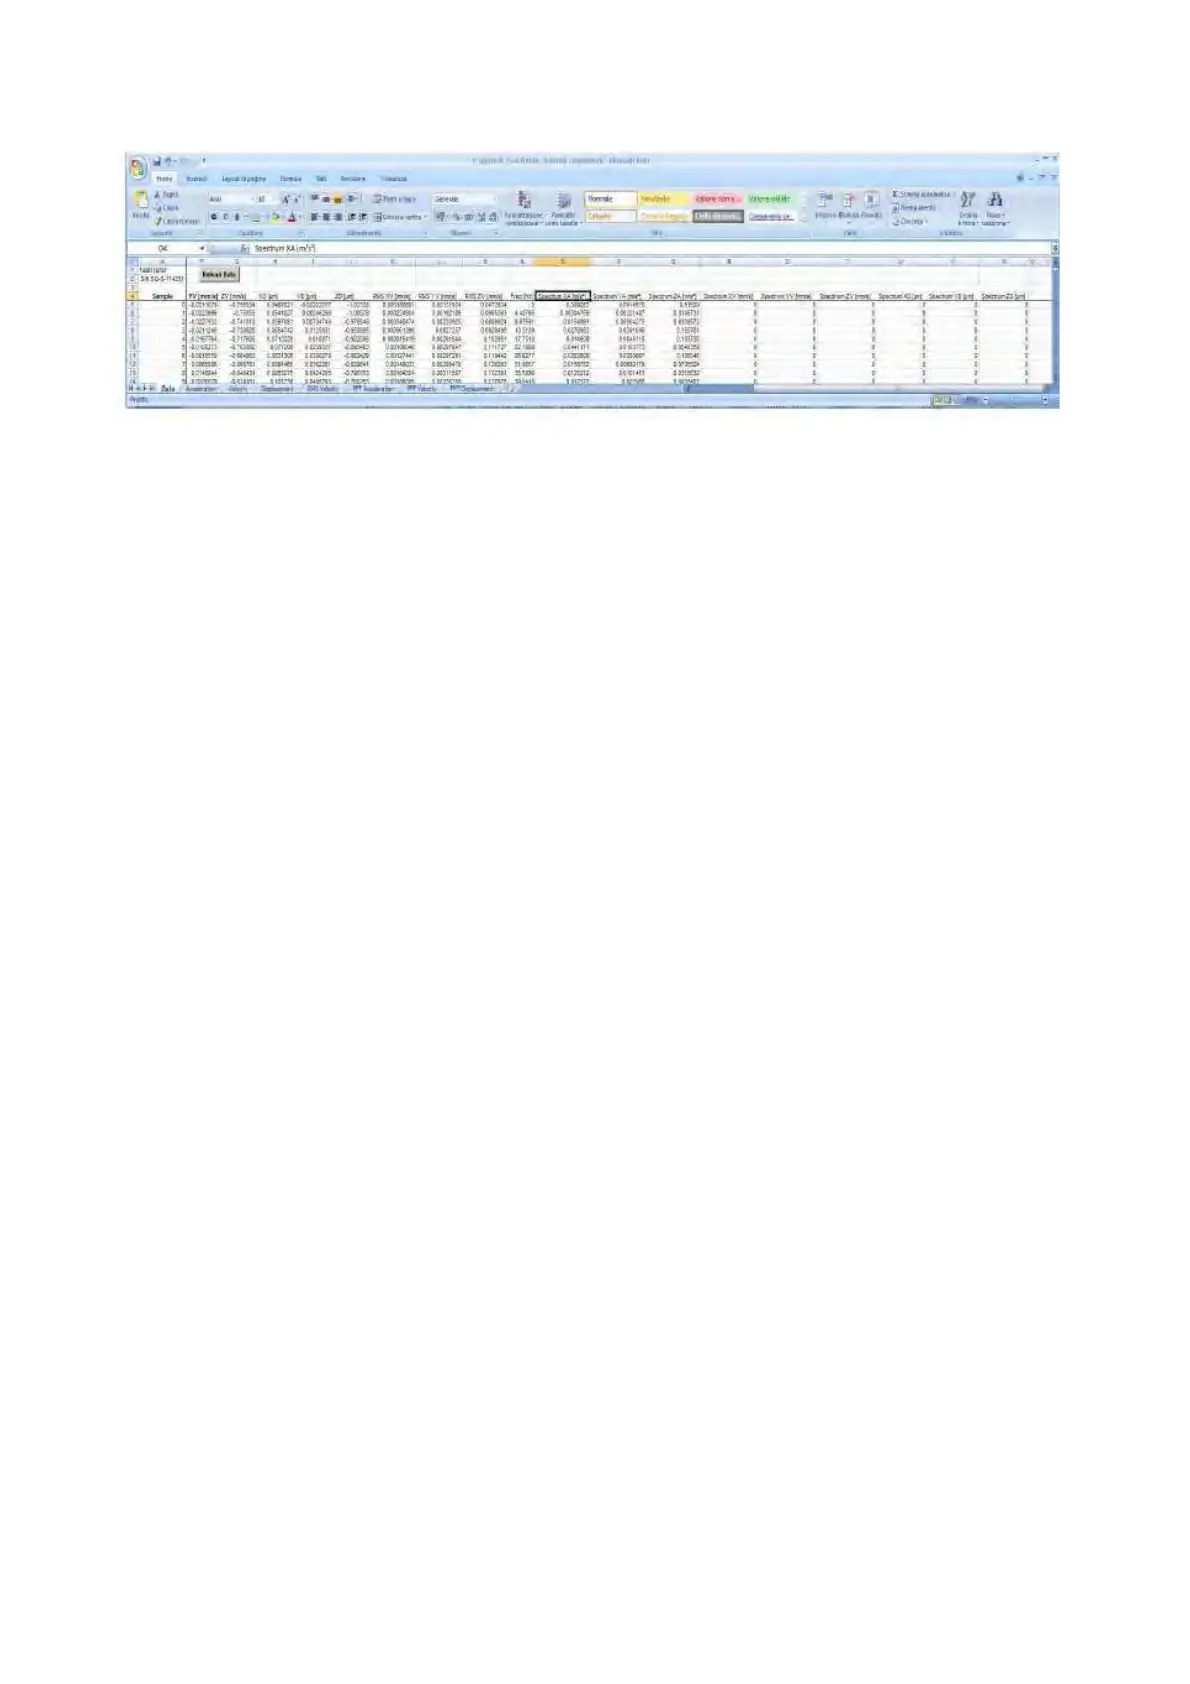
Microsoft Excel: document with analysed measures
The Microsoft Excel document consists of a spreadsheet with measures and diagrams examined in
the time and frequency domain. The spreadsheet provides the following columns of measures:
• Sample (independent axis for time domain measures)
• Acceleration (XA, YA, ZA);
• Velocity (XV, YV, ZV);
• Displacement (XD, YD, ZD);
• Velocity RMS (RMS XV, RMS YV, RMS ZV);
• Frequency (independent axis for frequency domain measures)
• Acceleration spectrum (Spectrum XA, Spectrum YA, Spectrum ZA);
• Velocity spectrum (Spectrum XV, Spectrum YV, Spectrum ZV);
• Displacement spectrum (Spectrum XD, Spectrum YD, Spectrum ZD).
3.8.1 Note on Microsoft Excel configuration
To import data to Microsoft Excel, enable external data macros and connections following the
recommendations below:
→ Click on the Microsoft Office key and then Excel options;
→ Click on Protection Centre and then Protection Centre Settings;
→ Find Macro Settings and select “Enable all macros”;
→ Find the external Content in the “Data connection protection settings” and select “Enable all
connections”;