CGM User Guide
41 Section 3 Understand Your iCan i3 CGM Results
1
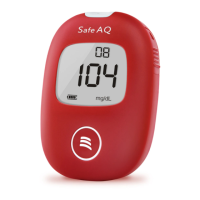
Sensor Glucose Result
Starting at the top, the number shows where your sensor glucose is
now in milligrams per deciliter (mg/dL). The background color of the
Glucose Graph can be yellow, green, orange, or red, it means:
200 mg/dL (11.1 mmol/L) Yellow: Above High Glucose Level (pre-set
at 200 mg/dL)
175 mg/dL (9.7 mmol/L) Green: Within the target range
69 mg/dL (3.8 mmol/L) Orange: Below Low Glucose Level (per-set at
70 mg/dL)
55 mg/dL (3.1 mmol/L) Red: Hypoglycemia Alert (set at 55 mg/dL)
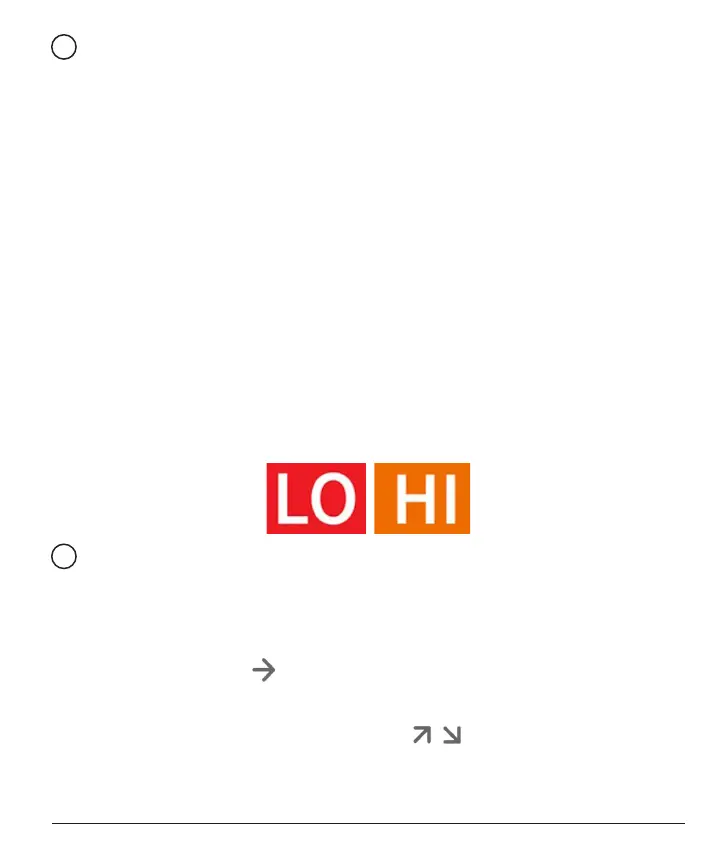
When your most recent CGM result is above 450 mg/dL (25.0 mmol/
L) or below 36 mg/dL (2.0 mmol/L), you will not get a number. Instead,
your display device will display LOW (Low) or HIGH (High). If you do
not have a number, use your blood glucose meter to measure your
glucose. These LOW or HIGH will be displayed as a blank spot on your
trend graph.
2
Trend Arrow
Trend arrows show the speed and direction of your glucose trends
based on your recent CGM results Use the arrows to know when to
take action before you are too high or too low.
Trend Arrow: Steady
Glucose is changing but less than 3 mg/dL (0.16mmol/L) per 3 minutes.
Trend Arrow: Rising or Falling slowly
Glucose is changing slowly, more than 3 mg/dL (0.16mmol/L) or up to
6 mg/dL (0.33mmol/L) per 3 minutes.