CGM User Guide
Section 3 Understand Your iCan i3 CGM Results 46
5
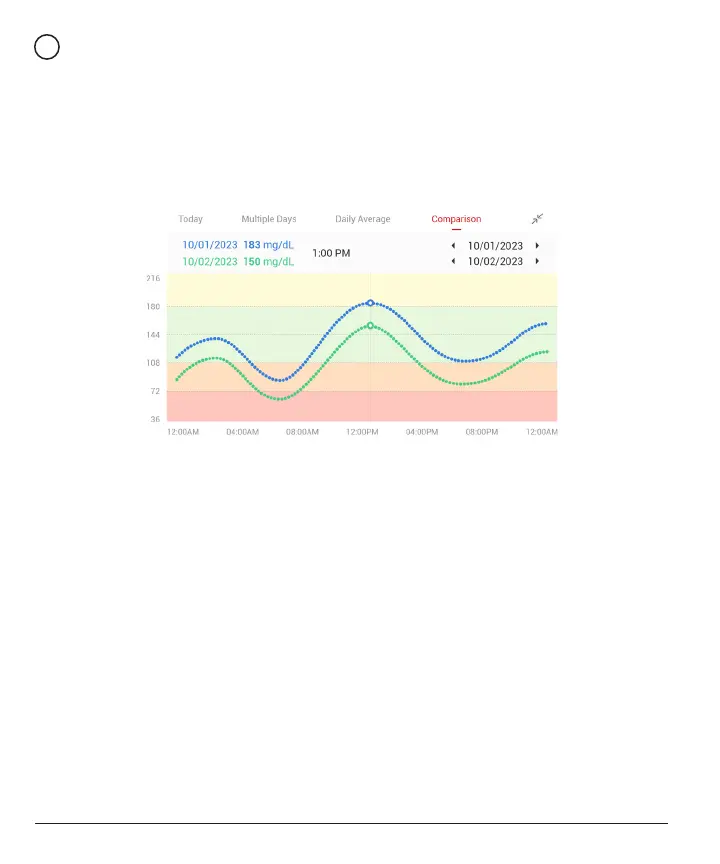
Comparison
The CGM APP allows you to select any 2 days from your past
monitoring and compare your monitoring results. The color coated line
in the graphic indicates the dates you select (on the right of the top
panel) and the white hollow dot means the glucose level (on the left of
the top panel) on a certain time.
3.3 Navigation and Status Bar
The APP includes sections where you can view a glucose overview
report, events history, and nd helpful information such as sensor
insertion instructions and the full Comprehensive Instruction for Use.
3.3.1 Glucose overview report
The glucose overview report allows you to create and share a report of
your previous glucose data, up to the last 15 days.
• In the APP, tap the “Events” button on the status bar at the bottom.
• Tap “History Report” and select the date range for which you want to
view.