CGM User Guide
Section 3 Understand Your iCan i3 CGM Results 42
Trend Arrow: Rising or Falling quickly
Glucose is changing quickly, more than 6 mg/dL (0.33mmol/L) or up to
9 mg/dL (0.5mmol/L) per 3 minutes.
Trend Arrow: Rising or Falling rapidly
Glucose is changing rapidly, more than 9 mg/dL (0.5 mmol/L) per 3
minutes.
3
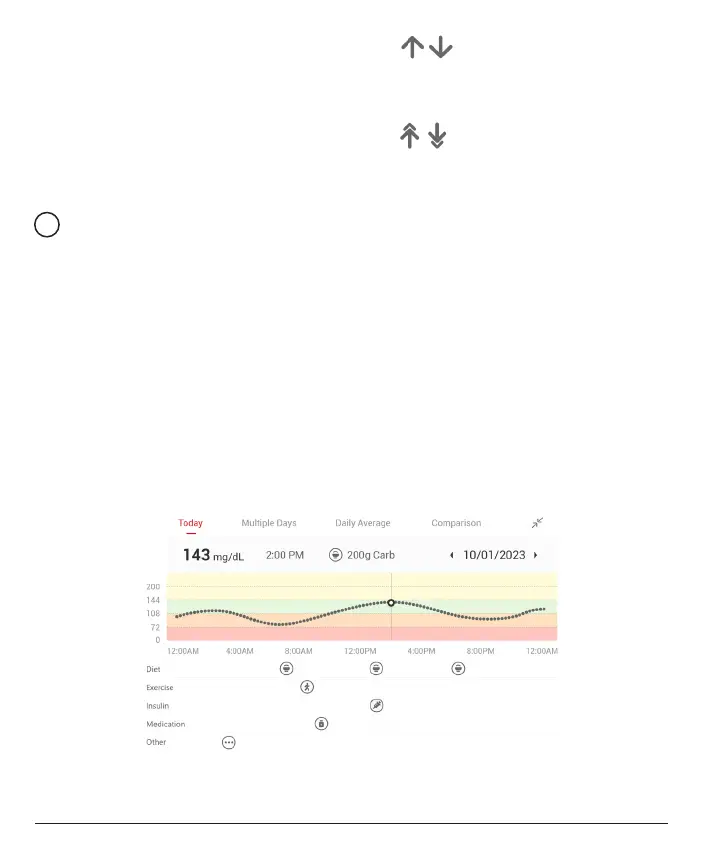
Trend Graph
The graph below shows where your CGM results have been for the
past few hours. It plots your CGM results every 3 minutes. The most
recent CGM result is the black dot on the right. The white hollow dot in
the middle is your glucose level on the selected time (for example in the
picture below, 143 mg/dL (7.9 mmol/L) is the glucose result at 2:00 PM).
The numbers on the left show glucose levels in mg/dL (mmol/L). The
numbers on the bottom show the time.
CAUTION:
If you are crossing various time zones, the CGM APP
displays all the glucose readings of the on-going session with their
testing time in the current time zone.