CGM User Guide
43 Section 3 Understand Your iCan i3 CGM Results
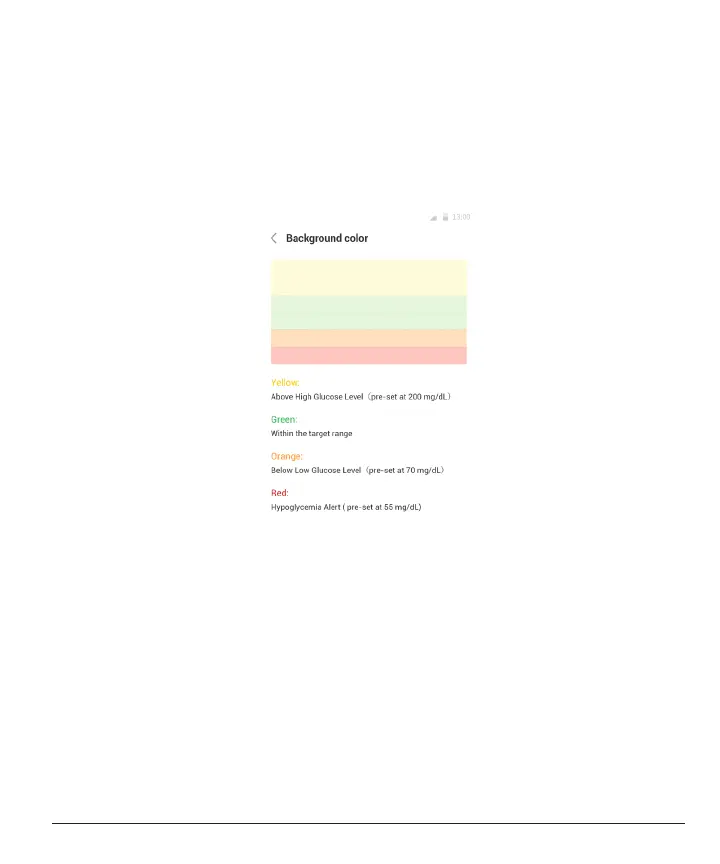
The horizontal lines show your High and Low Alert levels. Your glucose
is:
• High when your dots are in the yellow area of the graph.
• In your target range (between your high and low alert settings) when
in the green area
• Low when in the red area.
When the transmitter reconnects with the display device after a Signal
Loss or similar issue, up to 360 hours of missed CGM results can ll in
on the graph.