45
en
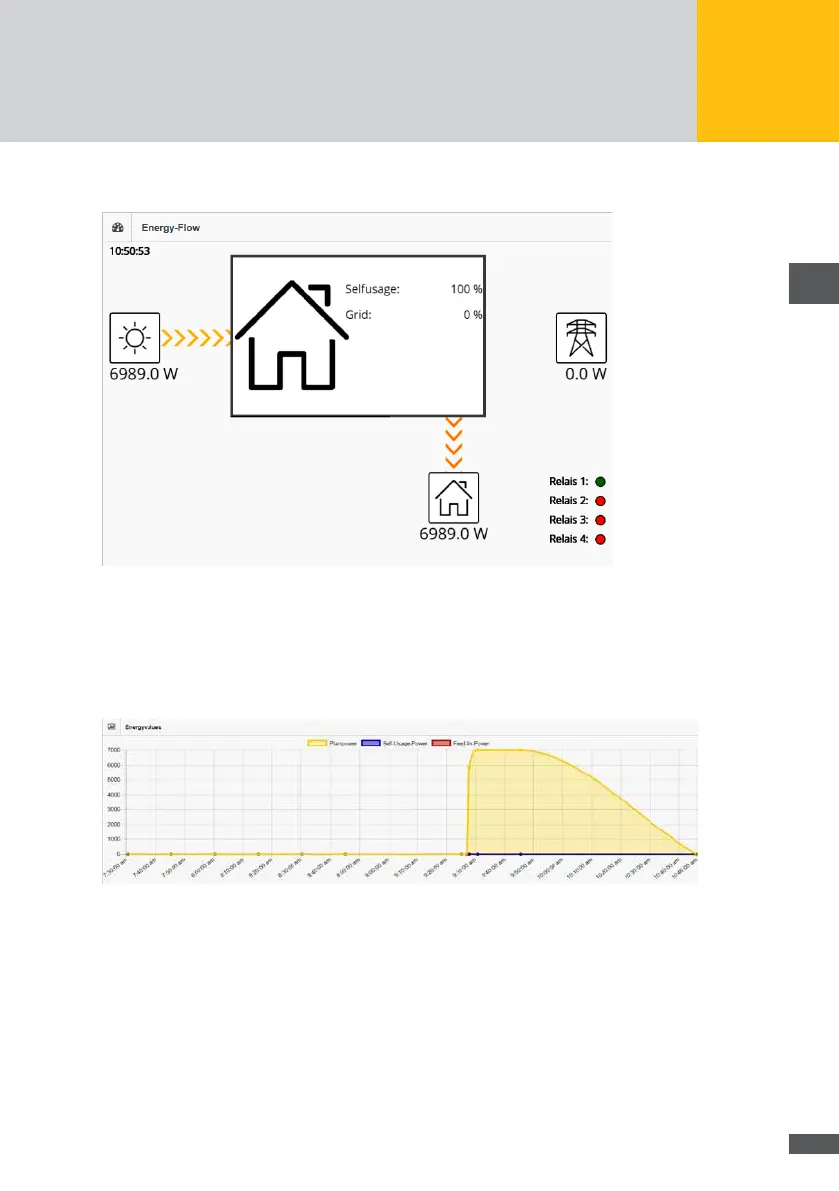
The following depiction of your plant will be displayed:
Fig. 35: Depiction of the energy ow
This picture represents the currently generated energy of the PV generator (yellow-grey
arrows), the internally consumed energy (orange-grey arrows) and the supplied energy
(red-grey arrows) as an overview.
A graphical depiction of the currently captured energy values will also be displayed.
Fig. 36: Depiction of energy values
The following energy values are shown in the picture:
Plant power (yellow)
Self consumption (blue)
Feed rate (red)
History
In order to display a picture of the energy values for a specic date, select “Energy>His-
tory” in the menu of MaxWeb XPN.