46
Control
Overview
History
Energy
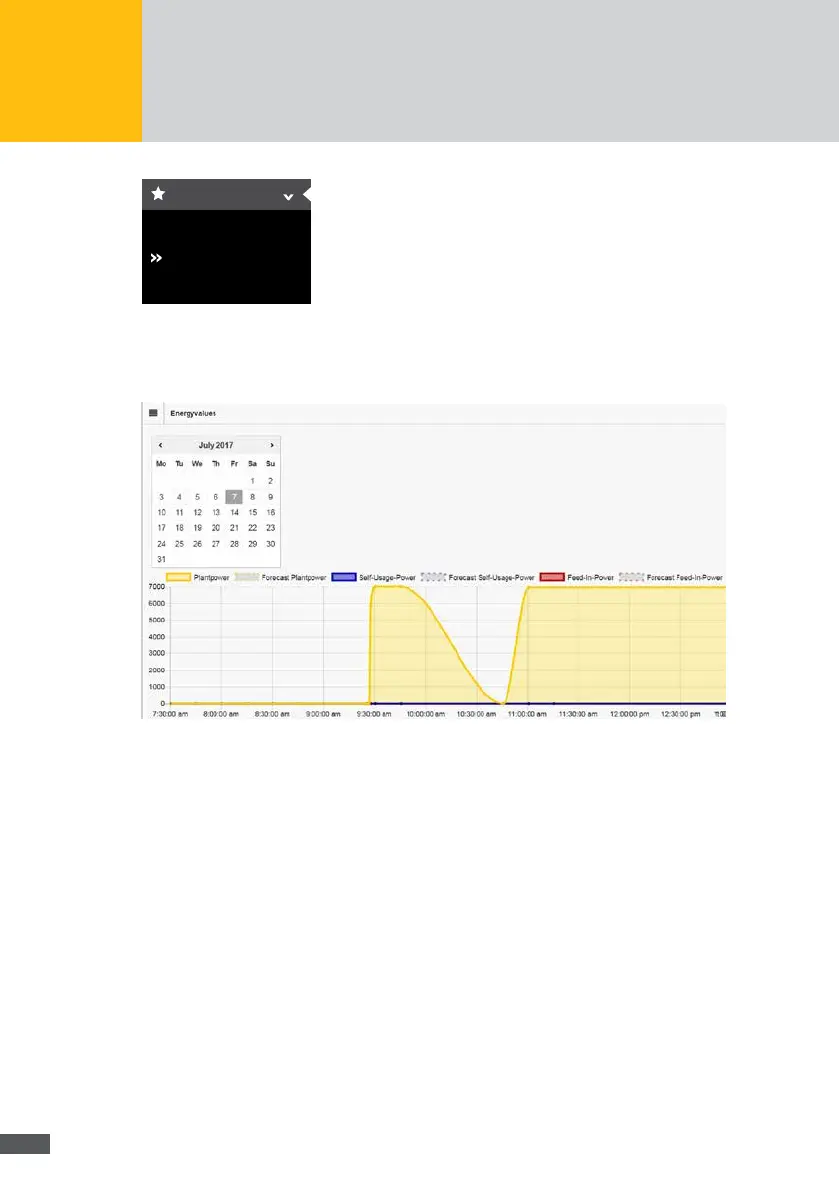
Fig. 37: Energy history menu
Select the date for which the energy values of your plant shall be displayed in the calendar
eld. The following graphical representation of the energy values are displayed:
Fig. 38: Graphical depiction of energy values
The following energy values of the plant can be displayed.
Plant power (yellow)
Plant power forecast (dotted in yellow)
Self consumption (blue)
Self consumption forecast (dotted in blue)
Feed rate (red)
Feed rate forecast (dotted in red)
If a storage system is connected to the plant, the following energy values are displayed:
Battery power (green)
Forecast of the battery power (dotted in green)
Battery energy (red)
Forecast of the battery energy (dotted in red)
Battery capacity (broken line in blue)
Forecast of battery capacity