3.3.2 Information
The information shown on the display is described below using illustrative examples.
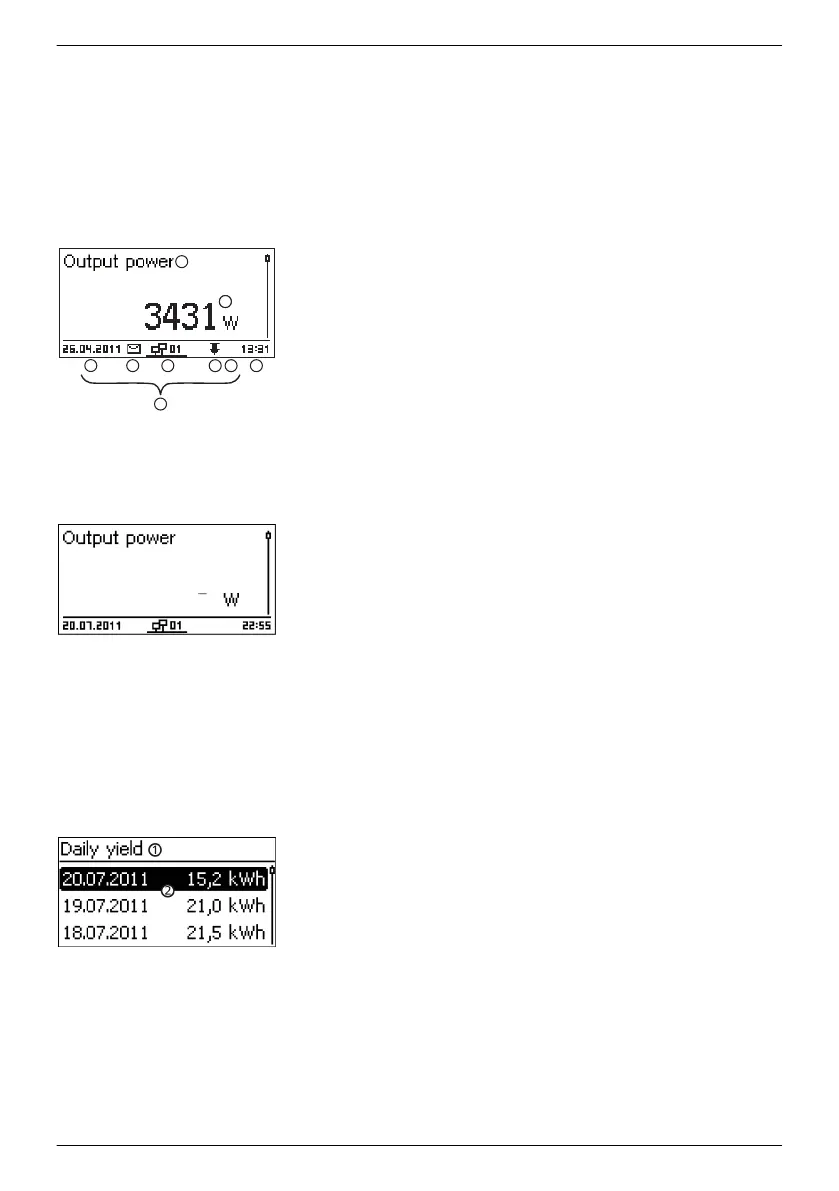
Status display
The status display shows the following values:
①
Measurement name
②
Measurement with units
③
Date is displayed alternatingly with IP address
④
Symbol Non-confirmed event messages; more information
on this is provided in Section
Ä
, p. 63
.
Animated Connect symbol with 2‑digit inverter address;
indicates data traffic on the RS485 bus.
⑥
Symbol Derating (Derating)
①
Symbol Fixed voltage mode activated
⑦
Time
⑧
Time
⑨
IP address of the device when a network connection has
been established, display alternates with ③ – ⑦
The following applies to the status display:
n The measurements shown in the status display are defined
under Settings ▶ Meas. values. Some measurements are
always displayed (default setting).
n Current values are not displayed at night (solar irradiation too
low; example in Fig. left).
n The CO2 saving shown in the status display are calculated
using the savings factor 508 g/kWh .
Numeric yield (day, month, year)
Daily, monthly and annual yields can be displayed numerically in a list.
①
Yield period (day/month/year)
②
Individual yields with period and value (1 per row)
The yield periods contain the following numbers of individual
entries:
Day yield: Last 31 days
1)
Monthly yield: Last 13 months
1)
Annual yield: Last 30 years
1)
1)
A yield value of 0 is shown when the inverter was not yet
installed at that time.
EN
747,431 | Z09 | 2015-09-30
17