5 Operation
Handling trailers
X
X
1000 kg
0 kg
1500 kg
3000 kg
4000 kg
(km)
(km/h)
1000
2000
3000 4000
5000
1
5
2
4
Rampe (%)
Force à la jante (N)
3
16 %
18 %
20 %
10 %
8 %
6 %
4 %
0
12 %
14 %
7,7
10
12
14
5,6
4
C
D
A
B
1050_003-021
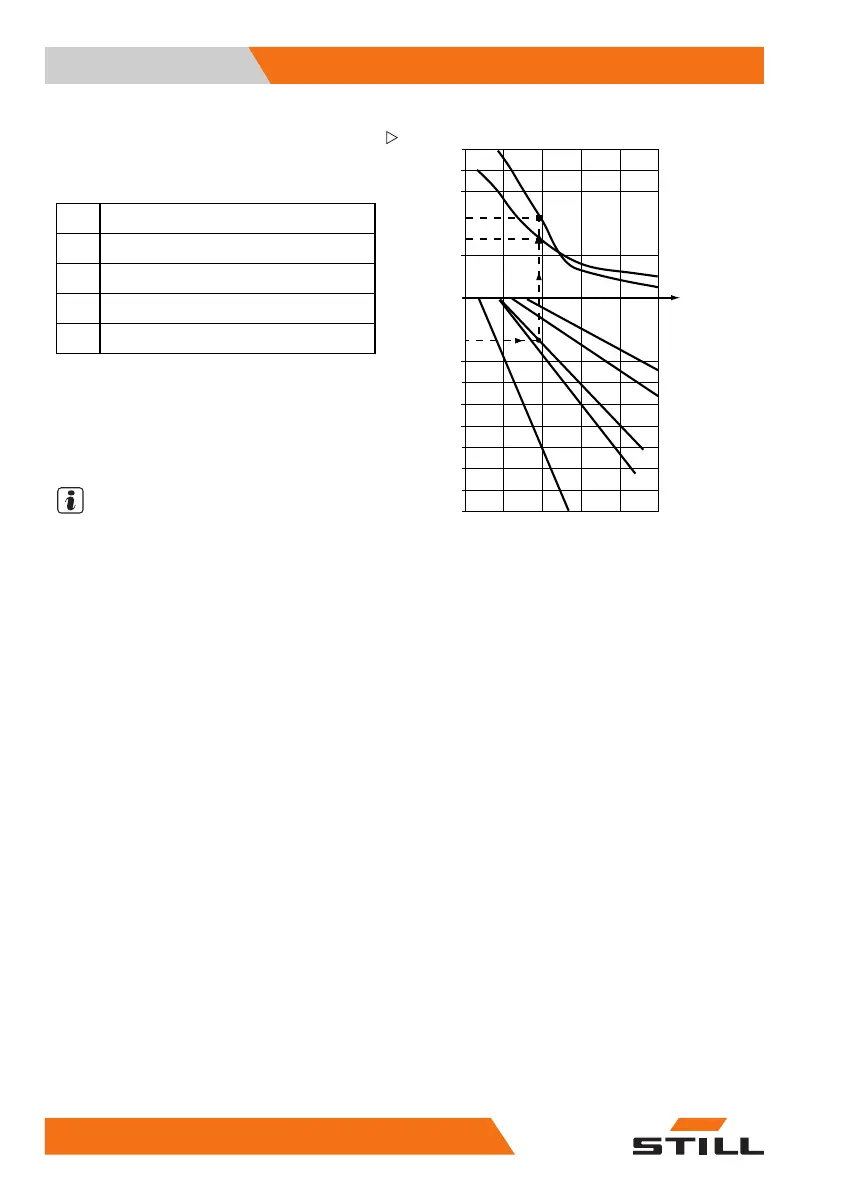
Example of towing capacity
The towing capacity diagram below contains
the following information:
1
Distance (km)
2
Speed (km/h)
3
Gradient (%)
4
Wheel traction nominal force (N)
5
Load (kg)
Reading from the diagram
On a 4% slope with a towed weight of 1500 kg,
the KANVAN can pull this load continuously at
5.6 km/h over 7.7 km of ramp and in addition
brake it when descending.
NOTE
• The values and curves
of the towing capac-
ity diagram apply onl
y to dry surfaces with a
good grip.
• The permitted journey per hour is the total
distance travelled, including the return
journey and the descent of possible slopes.
82
50108043033 [EN]
 Loading...