- 33 -
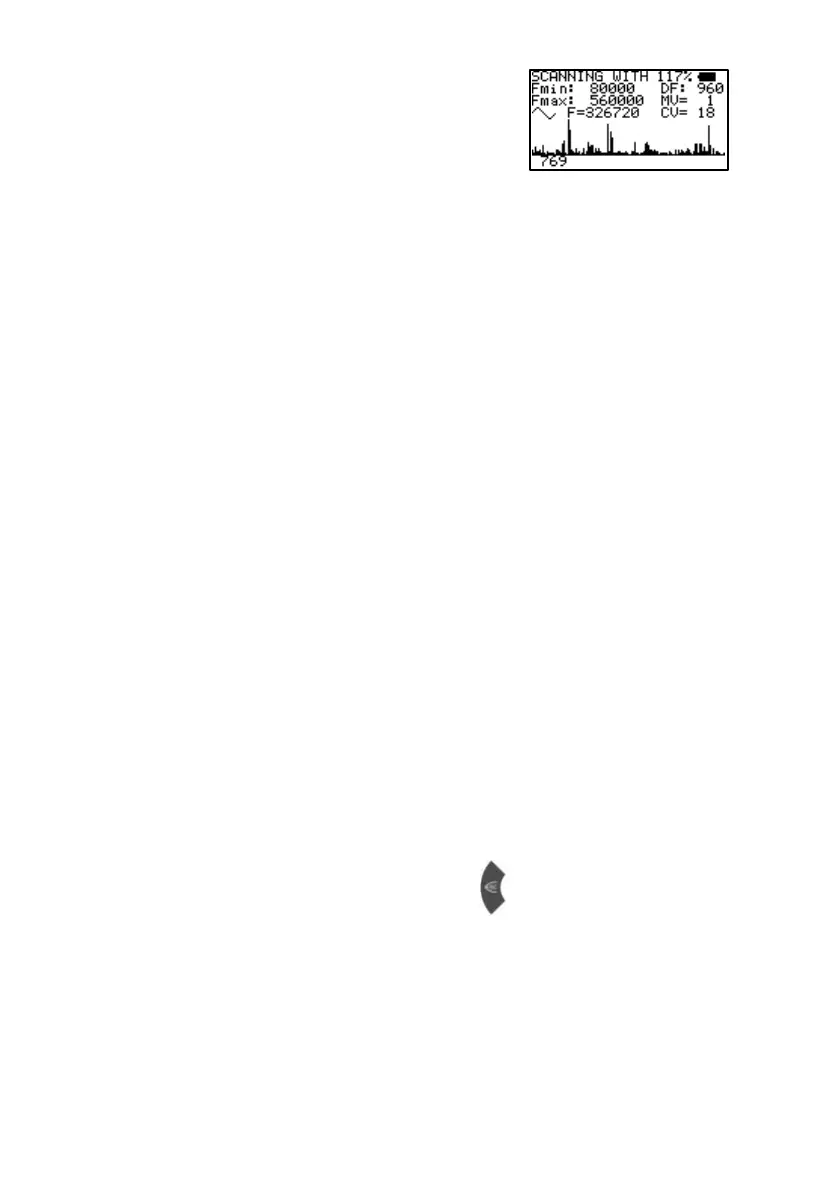
The progress of the analysis can be
follow ed on the display. The resulting
resonances are show n in graph form.
Wait until the scan is completed.
Legend:
Fmin: 80000 START frequency of the analysis.
Fmax: 560000 END frequency of the analysis.
DF: 960 Step size in Hz calculated to divide the range
betw een Fmin and Fmax in 500 steps of
equal length.
MV= 1 The resonance value of the frequency
currently applied. Small values w ill be
neglected and large values stored after
completion of the analysis.
CV= 18 The average Conductivity Value in % during
the run. (preferably between 5 % and 25 %)
F=326720 Value of frequency currently applied.
NOTE: KEEP HA NDHOLDS STEADY TO AVOID FALSE
REA DINGS!
NOTE: IF THE CV IS TOO HIGH, THERE WILL BE NO
GRAPHICAL REA DOUT ( FLAT LINE). TO REDUCE
THE CV, USE A STICKY PAD ELECTRODE ON TH E
RED CONNECTOR.
After completion of the analysis the display shows the number of
resonance values automatically selected for an application as HITS.
These values are stored in the program position opened before the
start.
5. Return to “INDIVIDUAL APPLIC“ or
KEY_F1 to reduce the CL (clipping level).
KEY_F3 to increase the clipping level.
the CL and resulting number of hits are being displayed in the bottom line.
KEY_RIGHT for jumping to the next HIT with indication of frequency and MV.