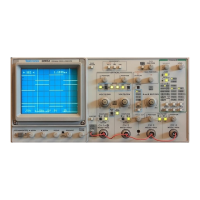
2213 Operators
Phase Difference
In a similar manner to “Time Difference,” phase com-
parison between two signals of the same frequency can be
made using the dual-trace feature of the 2213. This method
of phase difference measurement can be used up to the
frequency limit of the vertical system. To make a phase
comparison, use the following procedure:
1.
Preset instrument controls and obtain a baseline
trace, then set the TRIGGER SOU RCE switch to CH 1.
2. Set both AC-GND-DC switches to the same position,
depending on the type of input coupling desired.
3. Using either probes or coaxial cables with equal time
delays, connect a known reference signal to the Channel 1
input and the unknown signal to the Channel 2 input.
4. Select BOTH VERTICAL MODE; then select either
ALT or CHOP, depending on the frequency of the input
signals. The reference signal should precede the comparison
signal in time.
5. If the two signals are of opposite polarity, press
in the Channel 2 INVERT push button to invert the
Channel 2 display.
6. Set both
VOLTS/DIV
switches and both Variable
controls so the displays are equal in amplitude.
Phase
Difference
=
horizontal
difference
(divisions)
X
horizontal
graticule
calibration
(deg/div)
EXAMPLE:
The horizontal difference is 0.6 division
with a graticule calibration of
45’
per division as shown
in Figure 18.
Substituting the given values into the phase difference
formula:
Phase Difference = 0.6 div x
45’/div
=
27’
More accurate phase measurements can be made by
using the X10 Magnifier function to increase the sweep rate
without changing the
SEC/DIV
Variable control setting.
EXAMPLE:
If the sweep rate were increased 10 times
with the magnifier (X10 Magnifier out), the magnified
horizontal graticule calibration would be
45O/division
divided by 10 (or
4,5O/division).
Figure 19 shows the
same signals illustrated in Figure 18, but magnifying
the displays results in a horizontal difference of 6
divisions between the two signals.
Substituting the given values in the phase difference
formula:
Phase Difference = 6 div x
4.5’/div
=
27’
7. Adjust the TRIGGER LEVEL control for a stable
display.
8. Set the
SEC/DIV
switch to a sweep speed which
displays about one full cycle of the waveforms.
9. Position the displays and adjust the
SEC/DIV
Vari-
able control so that one reference-signal cycle occupies
exactly 8 horizontal graticule divisions at the 50% rise-time
points (see Figure 18). Each division of the graticule now
represents 45” of the cycle (360”
-+
8 divisions), and the
horizontal graticule calibration can be stated as 45” per
division.
10. Measure the horizontal difference between cor-
responding points on the waveforms at a common hori-
zontal graticule line (50% of rise time) and calculate the
phase difference using the following formula:
CHANNEL 1
CHANNEL 2
(REFERENCE)
r
(LAGGING)
8 DIVISIONS
MEASURE
HORIZONTAL
II-
I
I
T
I
I
I
I
-1
DIFFERENCE
\vvv
I
465/DM-0-15
Figure 18. Phase difference.
22
 Loading...