monitoring a patientchapter 7 7-7
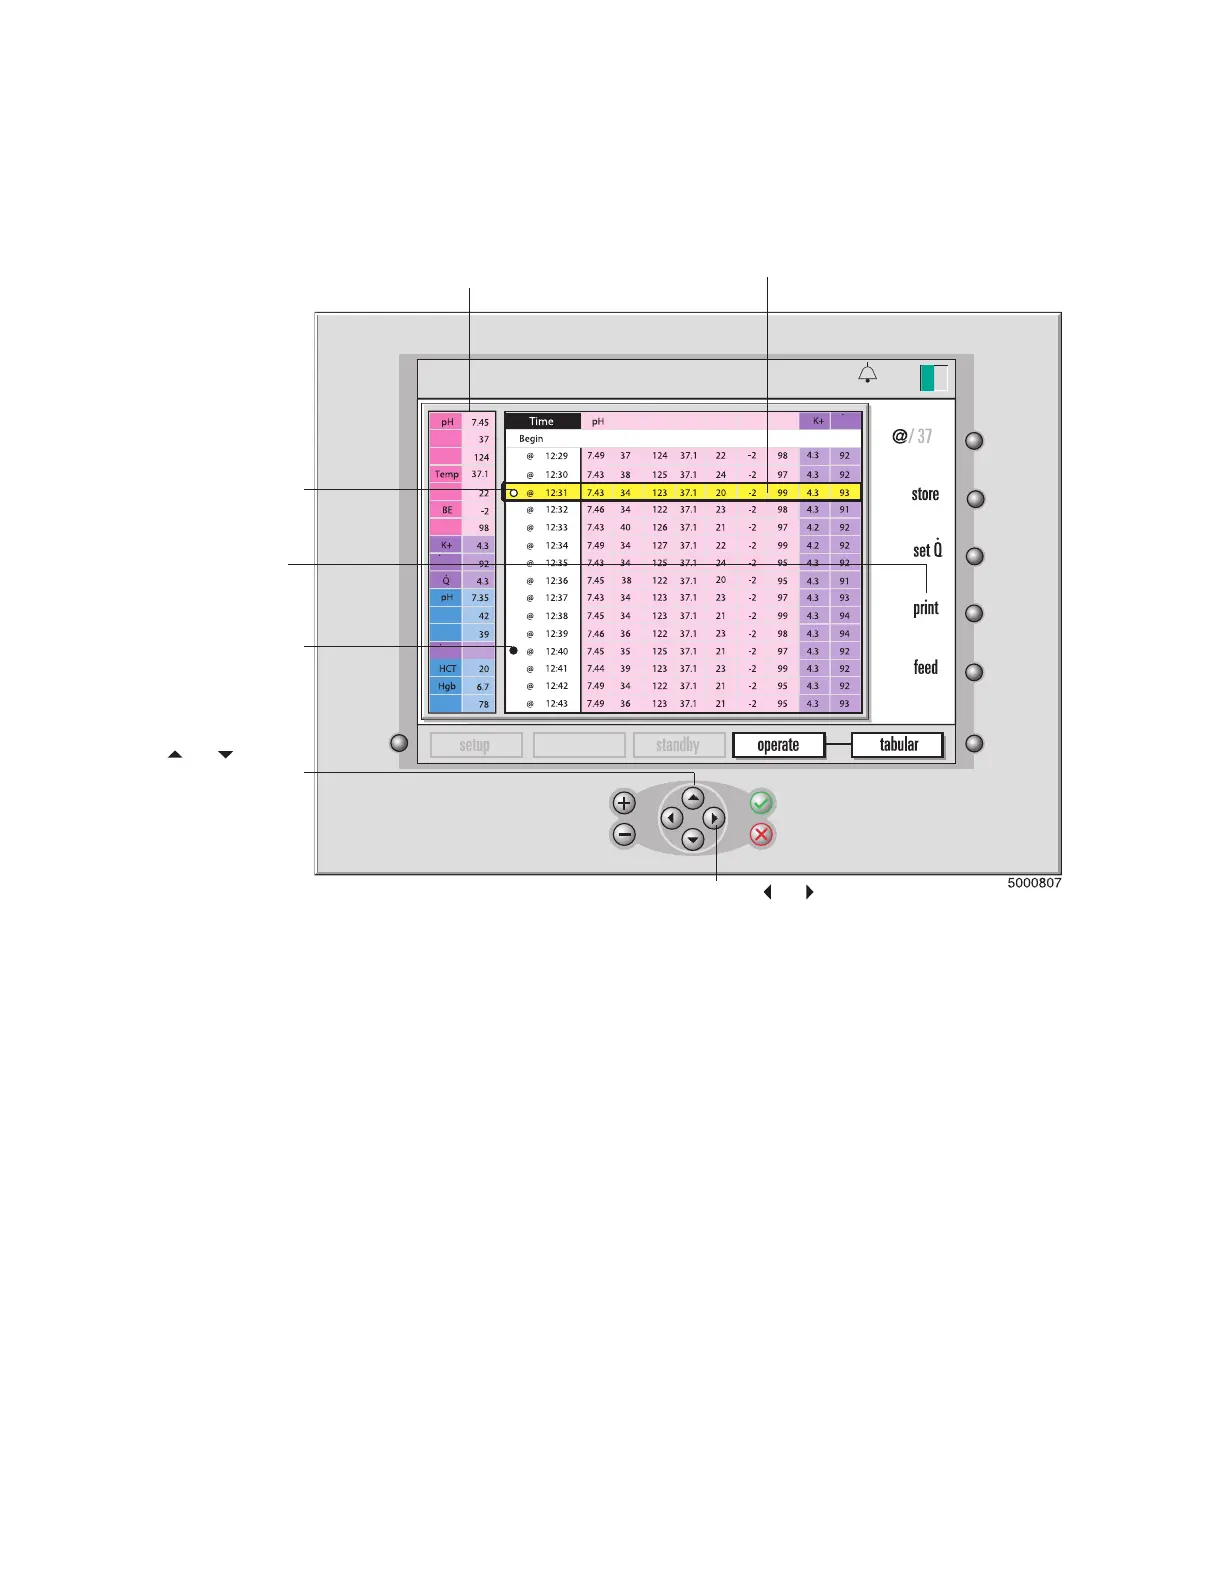
In tabular display mode (shown in the next gure), the current blood parameter
values are shown (in a reduced size) on the left side of the screen. The newest data
will be time stamped and added to the bottom (at 1 minute intervals).
Note:
Historical values are displayed in the original temperature mode (either actual
or 37°C), regardless of the current temperature mode. The “@” symbol indicates the
actual temperature mode. No symbol indicates 37° data.
Note: If you change the PCO2/PO2 units (mmHg or kPa) during a case, the historical
tabular data will be restated to match the current units.
Note: If a low priority physiological alarm event occurs while in the graphic or tabu-
lar display modes, the background color of the affected parameter value will be solid
yellow. If a medium priority physiological alarm event occurs while in the graphic or
tabular display modes, the background color of the affected parameter value will ash
yellow. An indication of HIGH or LOW will not be shown.
Use the and keys to view
values to the right or left of the
current display.
This symbol
indicates when
you pressed the
store key.
The print key prints all
the blood parameter
values for
the displayed
historical range.
This symbol indicates
when you did a
recalibration
adjustment.
and arrow
keys to scroll up and down
through the table.
The current blood
parameter values.
The values from the
selected time.
calibration
13:26
PCO2
PO2
HCO3
SO2
VO2
PCO2
PO2
DO2
SO2
PCO2
PO2
HCO
3
SO2
VO2
Temp
BE
9-25-18
pH-stat
465
°
C
 Loading...