choosing system settingschapter 4 4-7
Choosing graphic displays
During blood parameter measurement in the “operate” mode, the CDI System 550 can
display the patient’s blood gas parameter values in a graphical format. The graph will
show blood parameter values over two selectable time periods, so you can see changes
in a patient’s blood parameters at a glance.
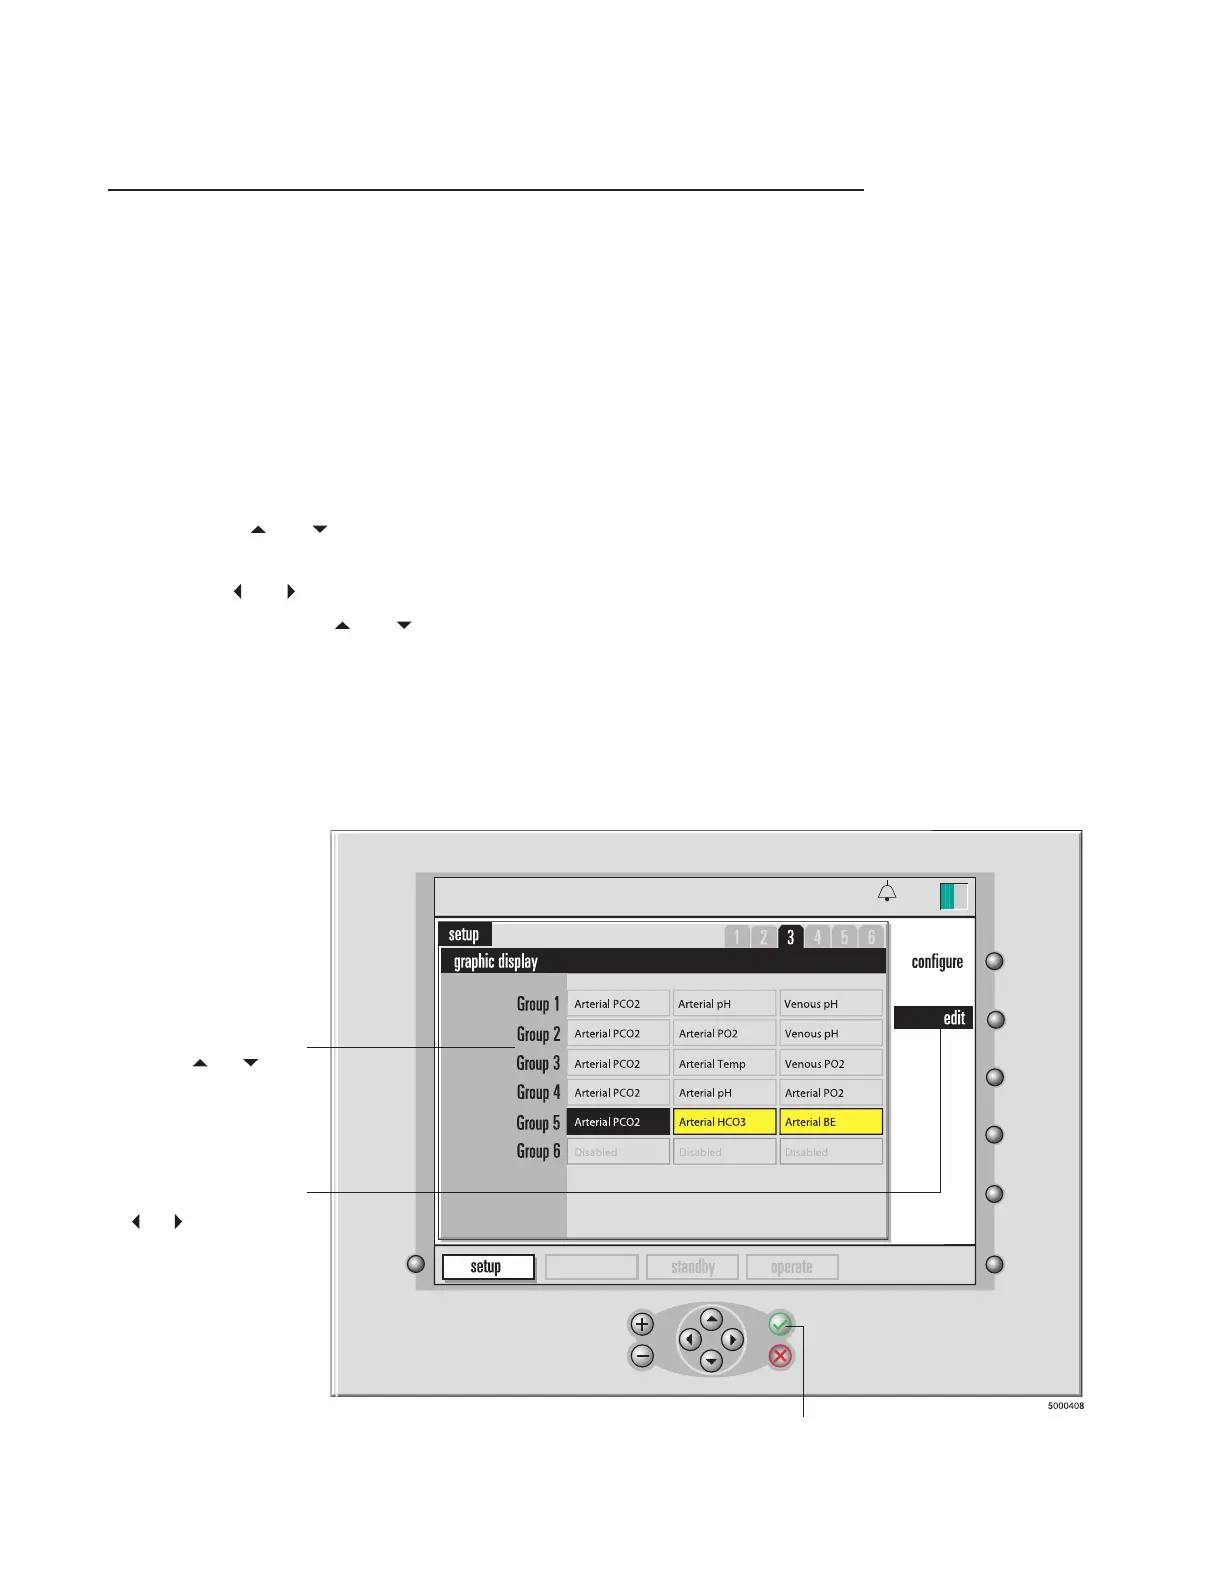
The third screen in setup mode — the graphic display screen — allows you to choose
which parameter values to display in the graphical format. You can specify up to six
groups of three parameters for graphic display — three graphs, each displaying values for
one parameter, can be displayed at one time.
On the graphic display setup screen, here’s how you use the selection and edit keys:
1 Press the and keys to select a group.
2 Press edit.
3 Use the and keys to highlight a particular item within the selected group.
4 Use the + and − or and keys to change the entry for the selected item.
The possible entries are listed in the next table.
Note: Any group can have one or more parameter(s) disabled. Only if all three are
disabled will the group be skipped over in graphics display. If a group has one or two dis-
abled parameters, that one or two will show up as a blank graph in the graphics display.
5 After you’ve selected all three items for a group, press √.
calibration
13:26
9-25-18
To highlight the group
you want to change,
use the and arrow
keys.
To change the highlighted
group, press edit, select an
item in the group with the
and arrow keys, then
press + and – to change
the entry for that item.
Press √ when you’re
finished selecting all
the items in a group.
 Loading...