9 Smart App
43
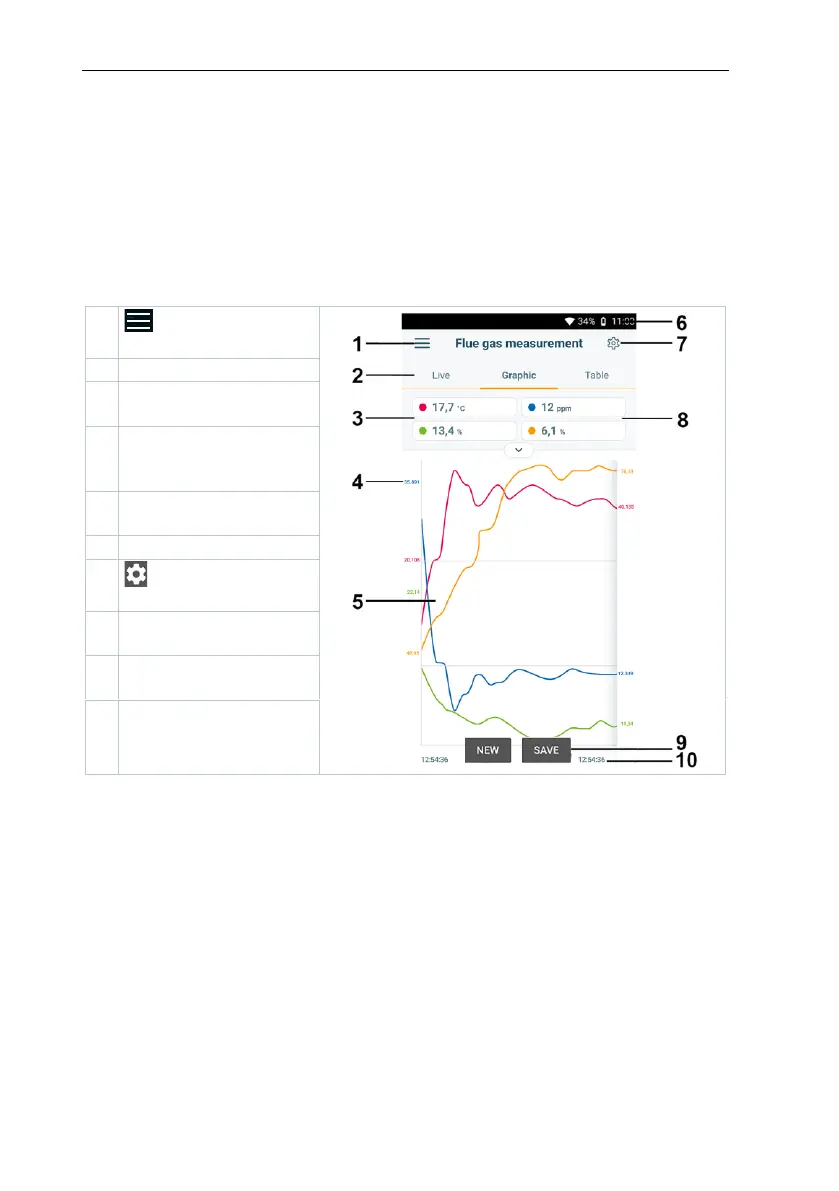
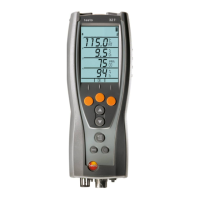
9.3.2 Graphic view
In the Graphic view, the values for a maximum 4 channels can be displayed
simultaneously in a chronological trend graph. All measured parameters can be
displayed in the Graphic view via the channel selection (click on one of the four
selection fields). Once a measurement parameter has been selected, the value
is updated automatically.
The Zoom touch function allows individual parts of the graphic to be viewed in
more detail or time progressions to be displayed compactly.