www.ti.com
BP-ADS7128 EVM Initial Setup
21
SBAU331–May 2019
Submit Documentation Feedback
Copyright © 2019, Texas Instruments Incorporated
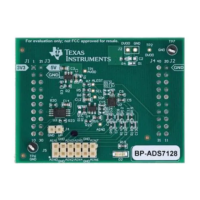
BP-ADS7128 BoosterPack™ Plug-In Module
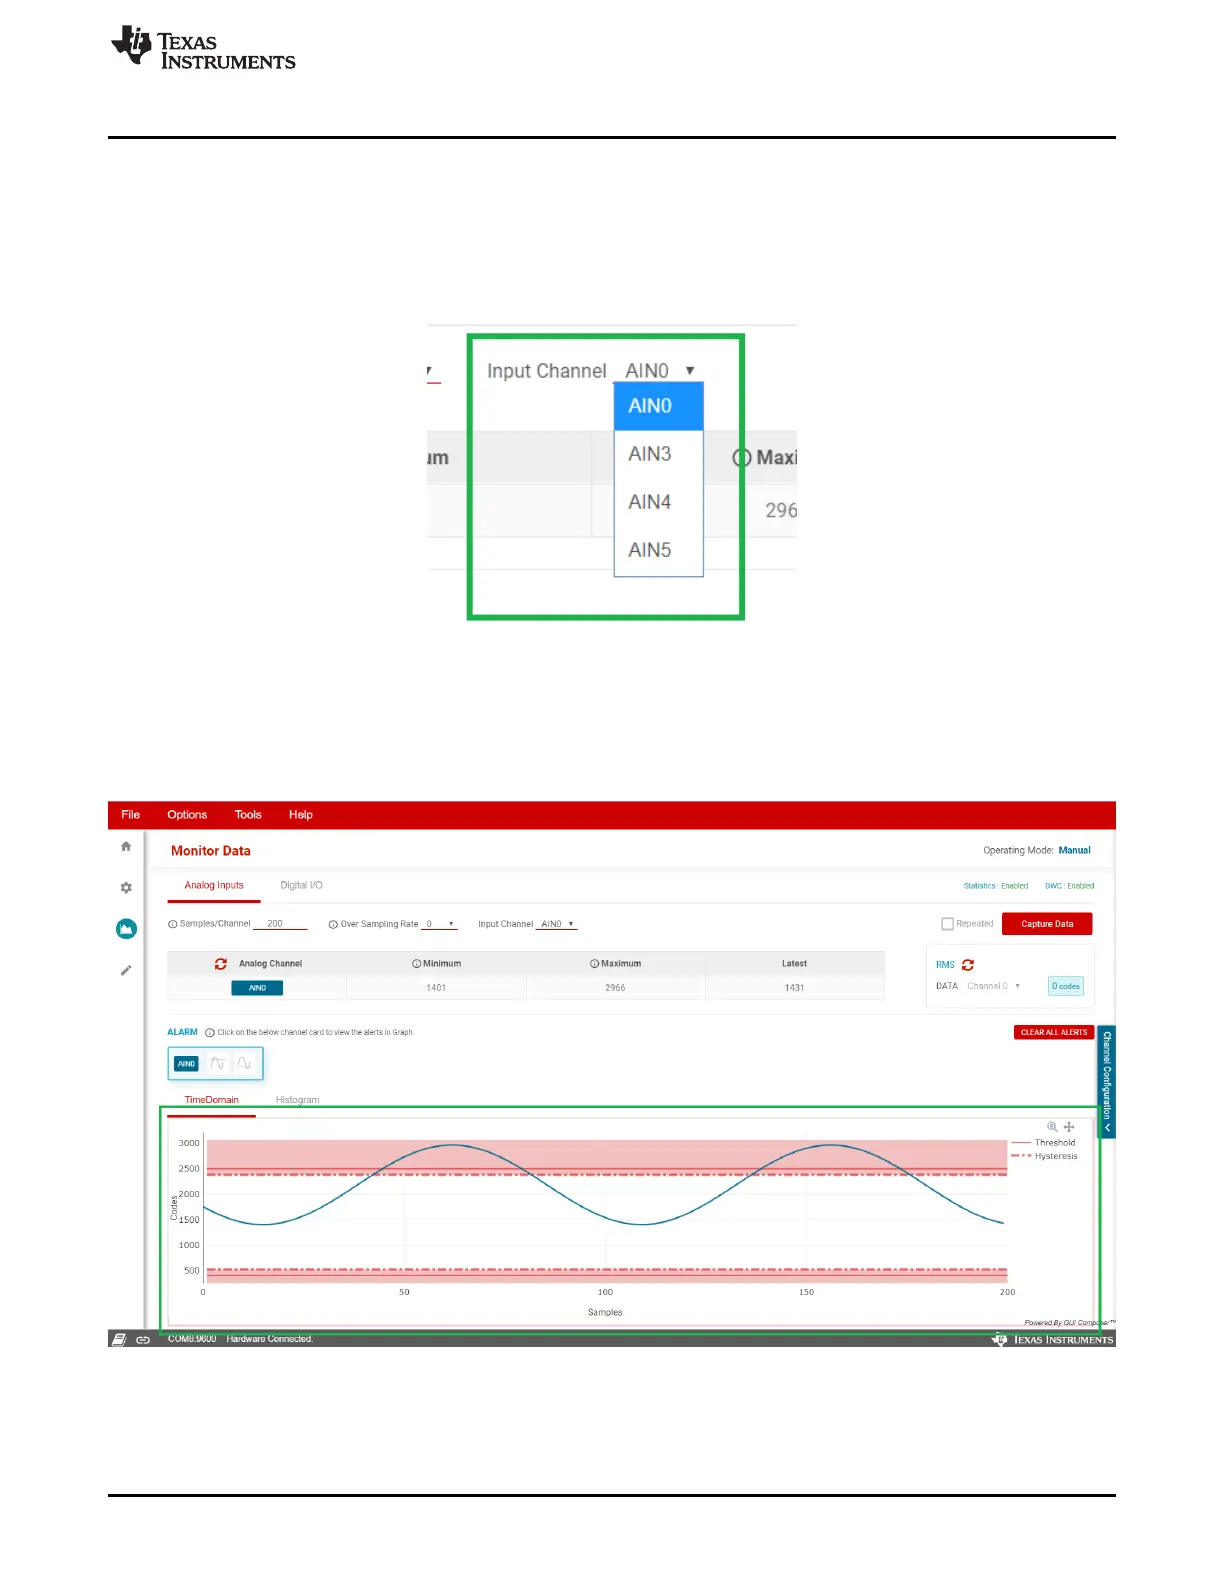
3.3.5.1.1 Time Domain Display
The time domain graph displays the conversion results of an analog input channel of a sampled data set.
When in manual mode, the graph can only display one analog input conversion results at a time; in auto-
sequence mode, all sampled channels are displayed. As shown in Figure 21, select the channel through
the drop-down menu shown.
Figure 21. Time Domain Channel Selection
Within the time domain graph, the high and low thresholds (configured in Section 3.3.2.2) are
automatically displayed inFigure 22 as solid red to visually demonstrate the levels that the analog signal
triggers an alarm. Hysteresis (if configured), is also displayed within this graph as dashed red lines.
Figure 22. Time Domain Display With Threshold and Hysteresis
 Loading...