BP-ADS7128 EVM Initial Setup
www.ti.com
22
SBAU331–May 2019
Submit Documentation Feedback
Copyright © 2019, Texas Instruments Incorporated
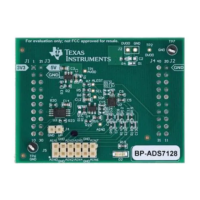
BP-ADS7128 BoosterPack™ Plug-In Module
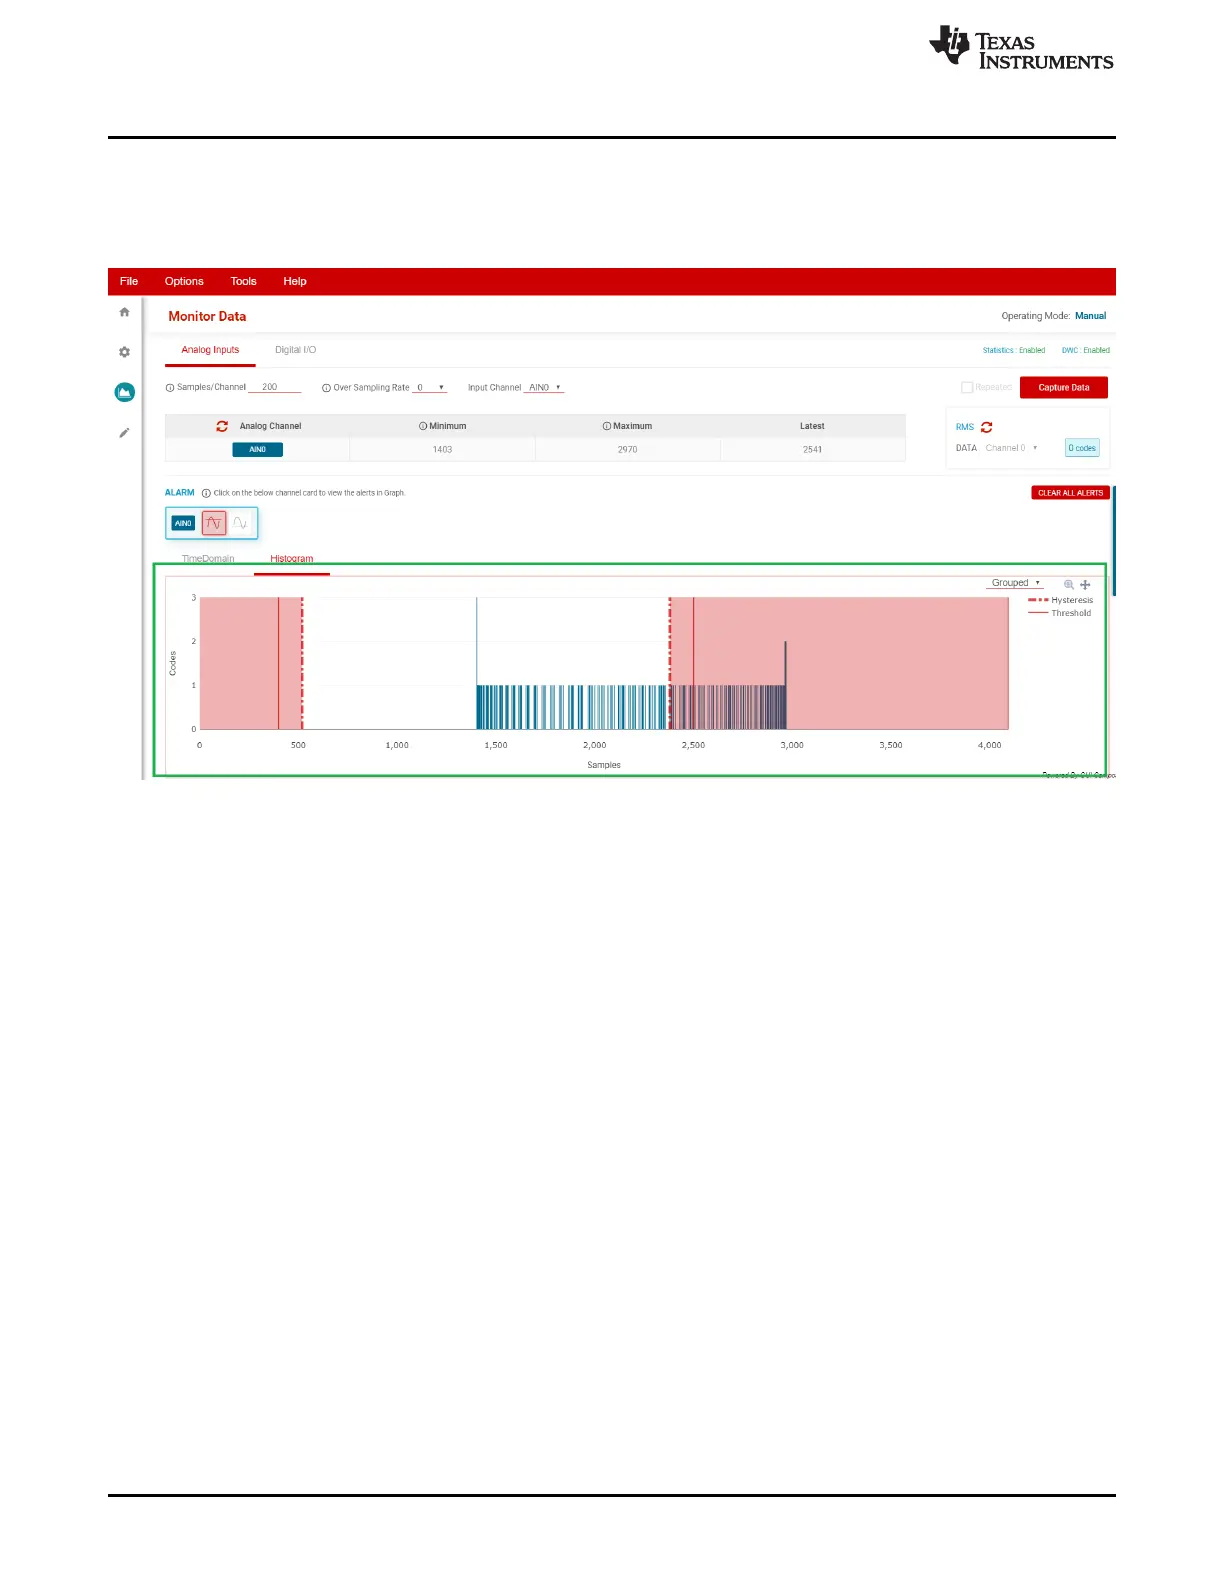
3.3.5.1.2 Histogram Graph Display
The conversion results can also be shown as a histogram through the histogram tab (shown in Figure 23)
within the analog input data capture. The high and low threshold levels and the configured hysteresis are
also displayed in the histogram graph.
Figure 23. Histogram Graph Display With Threshold and Hysteresis
 Loading...