20 Using the Scratchpad
• To graph a function, press b31.
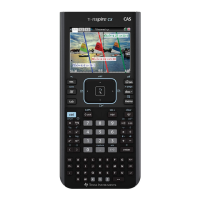
The entry line changes to display the expression format for the
specified graph type. You can specify multiple functions of each
graph type.
2. Type an expression and any other parameters required for the graph
type.
3. Press
· to graph the function, or press ¤ to add another function.
If necessary, you can use press
b4 to choose a tool on the
Window/Zoom
menu and adjust the viewing area.
When you graph the expression, the entry line disappears to show an
uncluttered view of the graph. If you select or trace a function, that
function displays on the entry line. You can change a function by
editing its expression or grabbing and changing the graph.
As you graph multiple functions on the axes, the label containing the
expression displays for each. You can define and graph a maximum of
99 functions of each type.
4. Use the
b key to explore and analyze the graphed function by
tracing it, finding points of interest, or assigning a variable in the
expression to a slider.
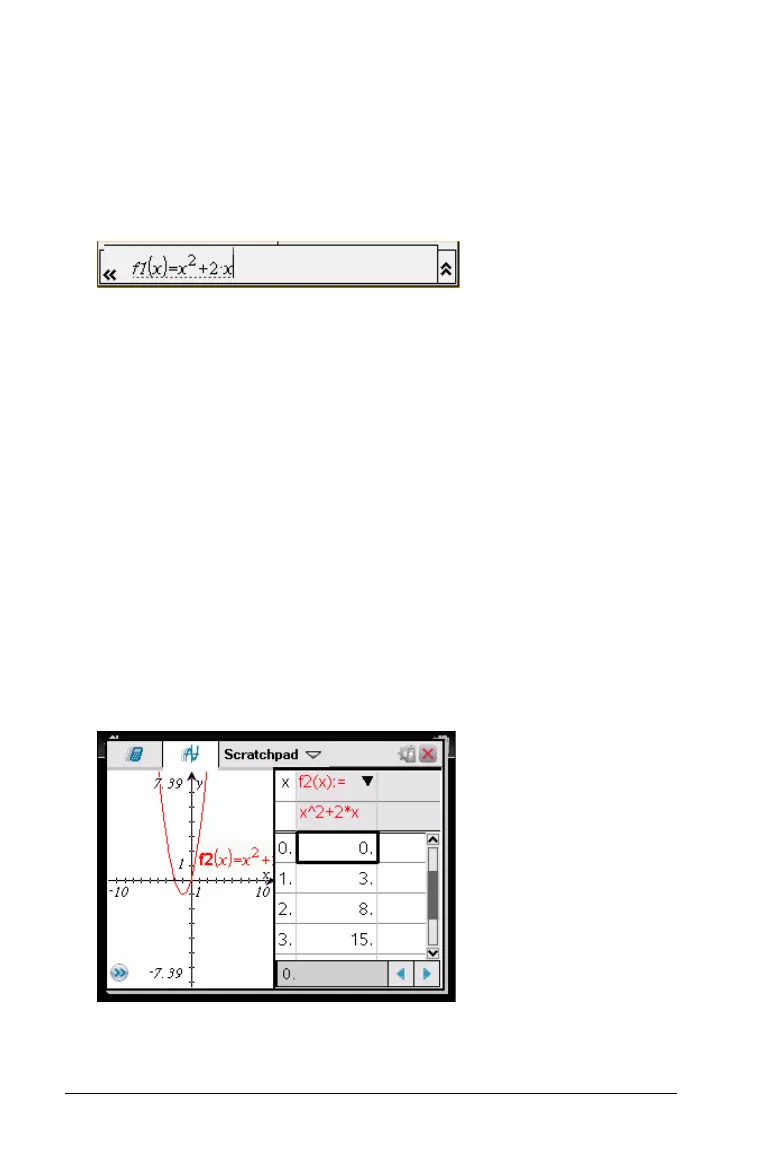
Viewing the function table
f To display a table of values for the current function, press b25.
f To hide the function table, click the graph and then press b25.
 Loading...