AS 680/682
Description, Operation and Maintenance Subsystem Description
ADS−B
2−27Ed. 10.07
The traffic situation is presented on a full−featured electronic map organized in layers representing
different object types like runways, taxiways, buildings, rivers, cities, roads, boundaries, etc. Individ-
ual layers can be enabled or disabled. The Technical Situation Display (’ADSB Display’) allows zoom-
ing, panning, rotation, layer switching, history setting, position/distance measurement, different
symbology, etc.
Targets are shown as symbol with track history and a short label attached. Targets of interest can be
selected with the mouse and their detailed full Asterix report data items can be shown in a side panel.
This allows easy online analysis of an aircraft’s ADS−B performance. The Technical Situation Display
accepts Asterix cat 21 data as an input to its network port. In addition to showing live traffic from a
selected Ground Station set, replayed or simulated data can be shown in the same way. They are
usually marked as simulated data. A more detailed description of the Technical Situation Display and
its use is given in section 4.4.
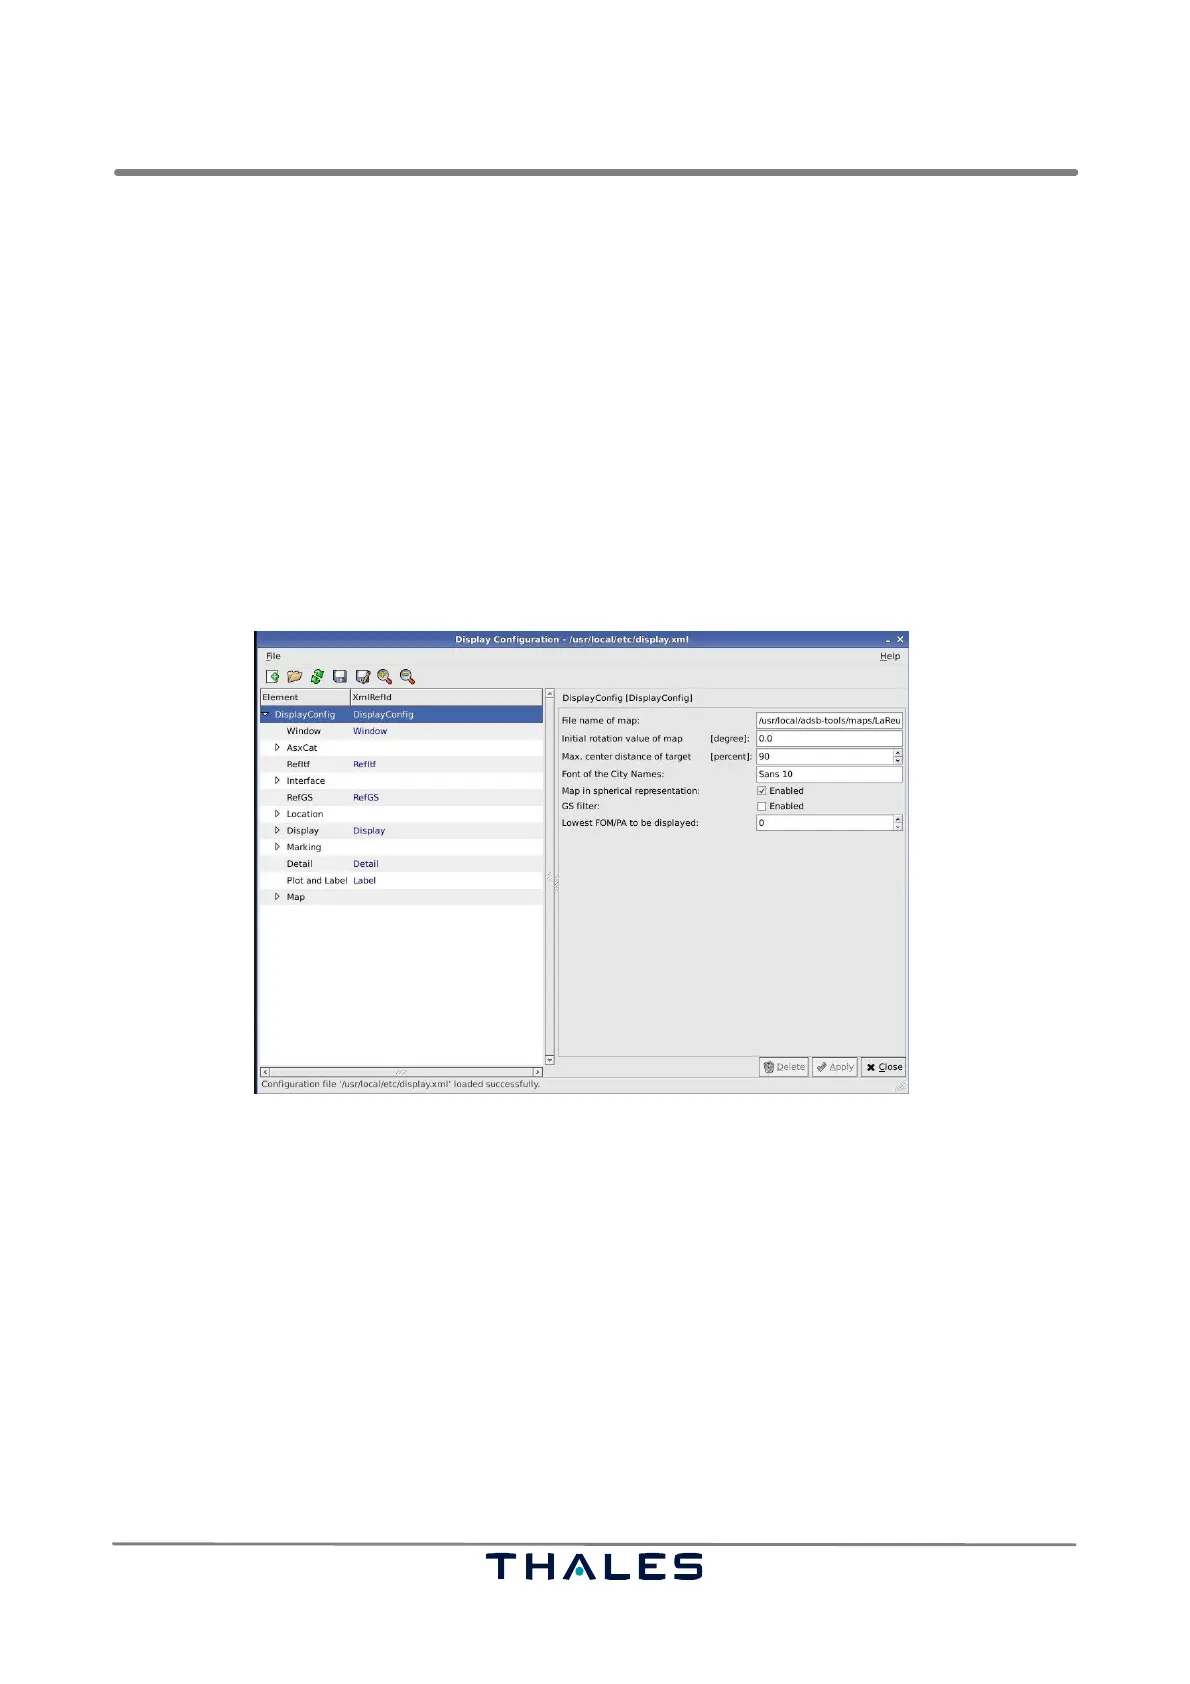
The Technical Situation Display is configured using an XML−based configuration file that can be con-
veniently edited with a dedicated Display Configuration tool (see section 4.4.2.1).
Fig. 2−32 Display Configuration tool for the Technical Situation Display (example)
2.4.3 Recording and Replay
Another functionality of the RCMS is recording and replay both ASTERIX CAT 21 data and raw de-
coded Mode S data (i.e. telegram contents, confidence bits, time of arrival, power level, etc.) as re-
ceived by the Ground Station hardware. Recorded data are stored either in readable ASCII format
or as binary file in order to conserve hard disk space.
While recording Asterix data, the tool is able to display the decoded output on the screen, to store
everything in a format readable by standard spreadsheet programs and to copy the recorded data
to another network address and port. The replay tools allow to select partial replays, faster/slower
than life replays, etc. Depending on the available ground network bandwidth raw data logging could
also be done from a remote station.
More details about all application tools may be found in Chapter 4.
 Loading...