VICTOR TECHNOLOGY
42
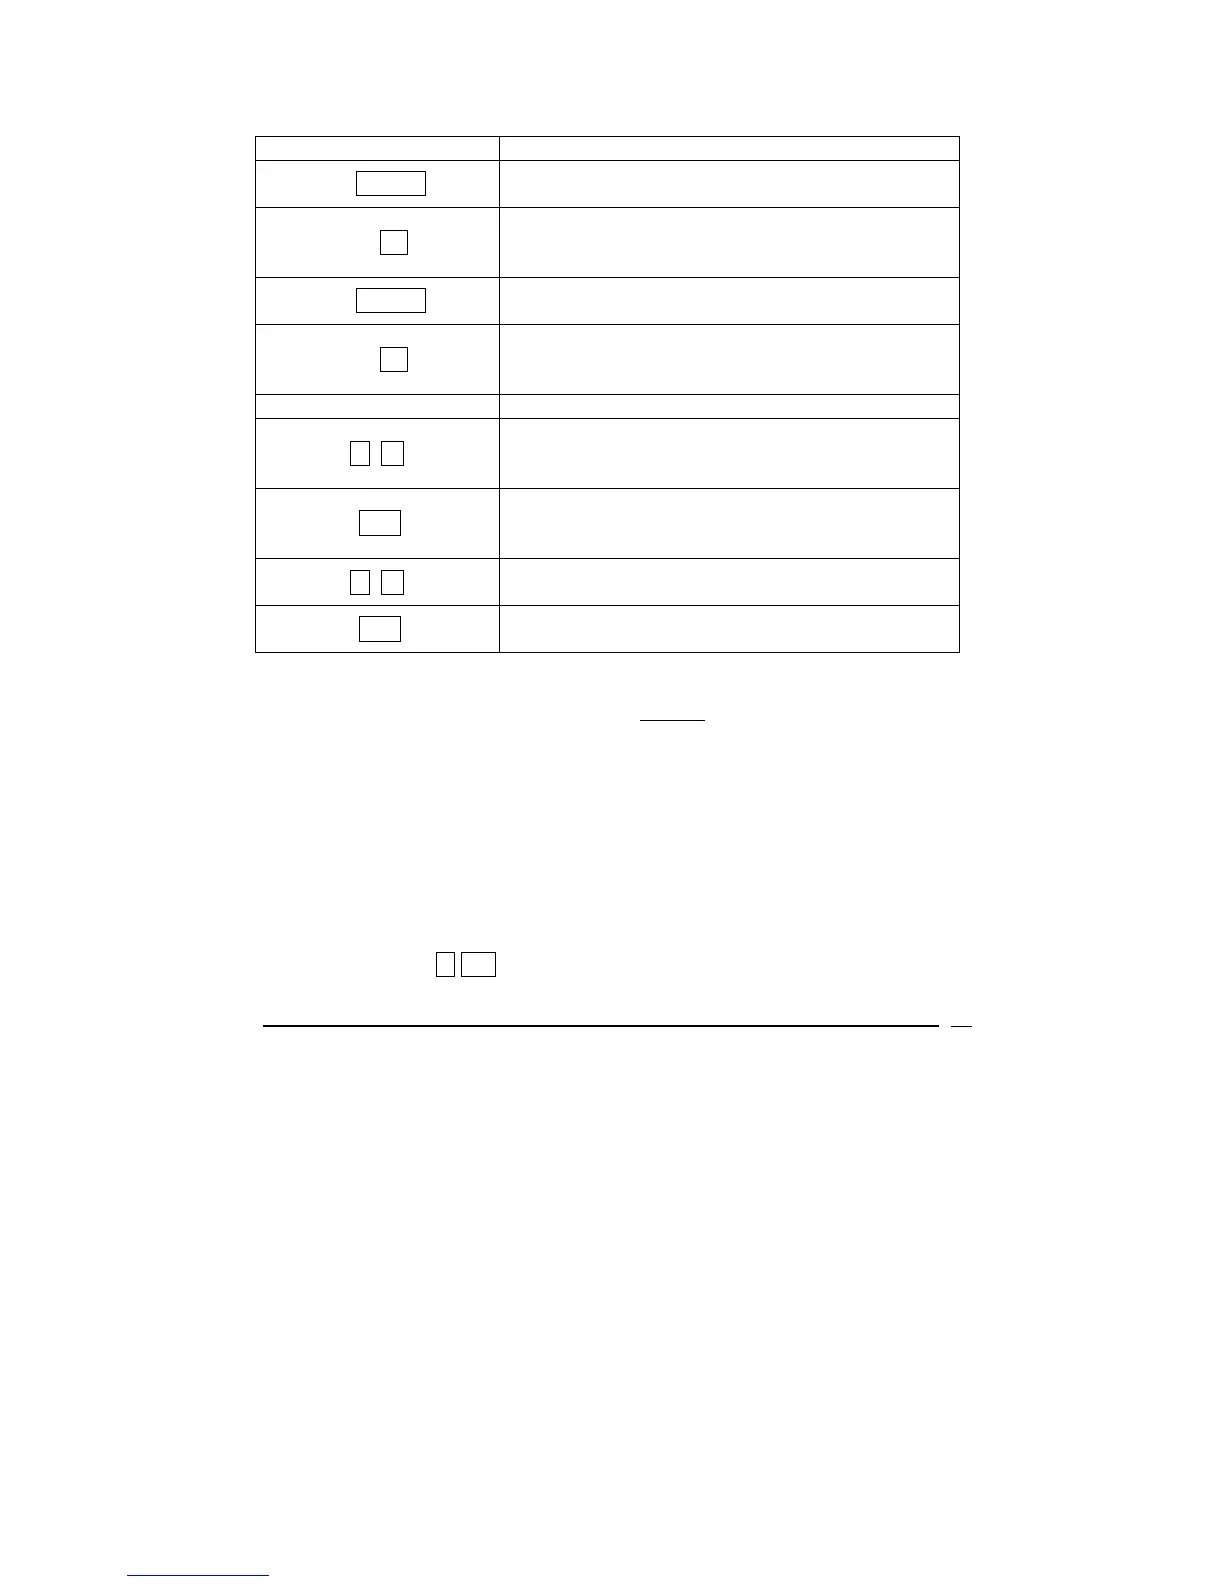
ENTRIES DISPLAY
48 ENTER
48.00
Displays the first y value.
85 ∑+
1.00
Displays which entry has just been entered …
the first data pair.
51 ENTER
51.00
Displays the second y value.
76 ∑+
2.00
Displays which entry has just been entered …
the second data pair.
… etc. … etc. until all 10 data pairs have been entered.
r s.
10.77
Displays the standard deviation for the x values
(Weight).
x↔y
4.70
Displays the standard deviation for the y values
(Height).
r x.
61.80
Displays the mean for the x values (Weight).
x↔y
42.60
Displays the mean for the y values (Height).
Note: The above example provides the best estimates of the standard
deviation assuming the data provided is a sample
of the population and not the
entire population.
Linear Estimates for x and y
When two-variable statistical information is stored in the statistical registers, an
estimated y value can be calculated using a new x value or an estimated x
value can be calculated using a new y value.
To estimate y:
¾ Enter the new x value
¾ Touch r y, r
To estimate x:
 Loading...