Appendix E: TROUBLESHOOTING
Appendix E-1: Viewing Diagnostic Information
• Type the IP Address of the ProtoNode into your web browser or use the FieldServer
Toolbox to connect to the ProtoNode.
• Click on the Diagnostics and Debugging button (see Figure 4-1).
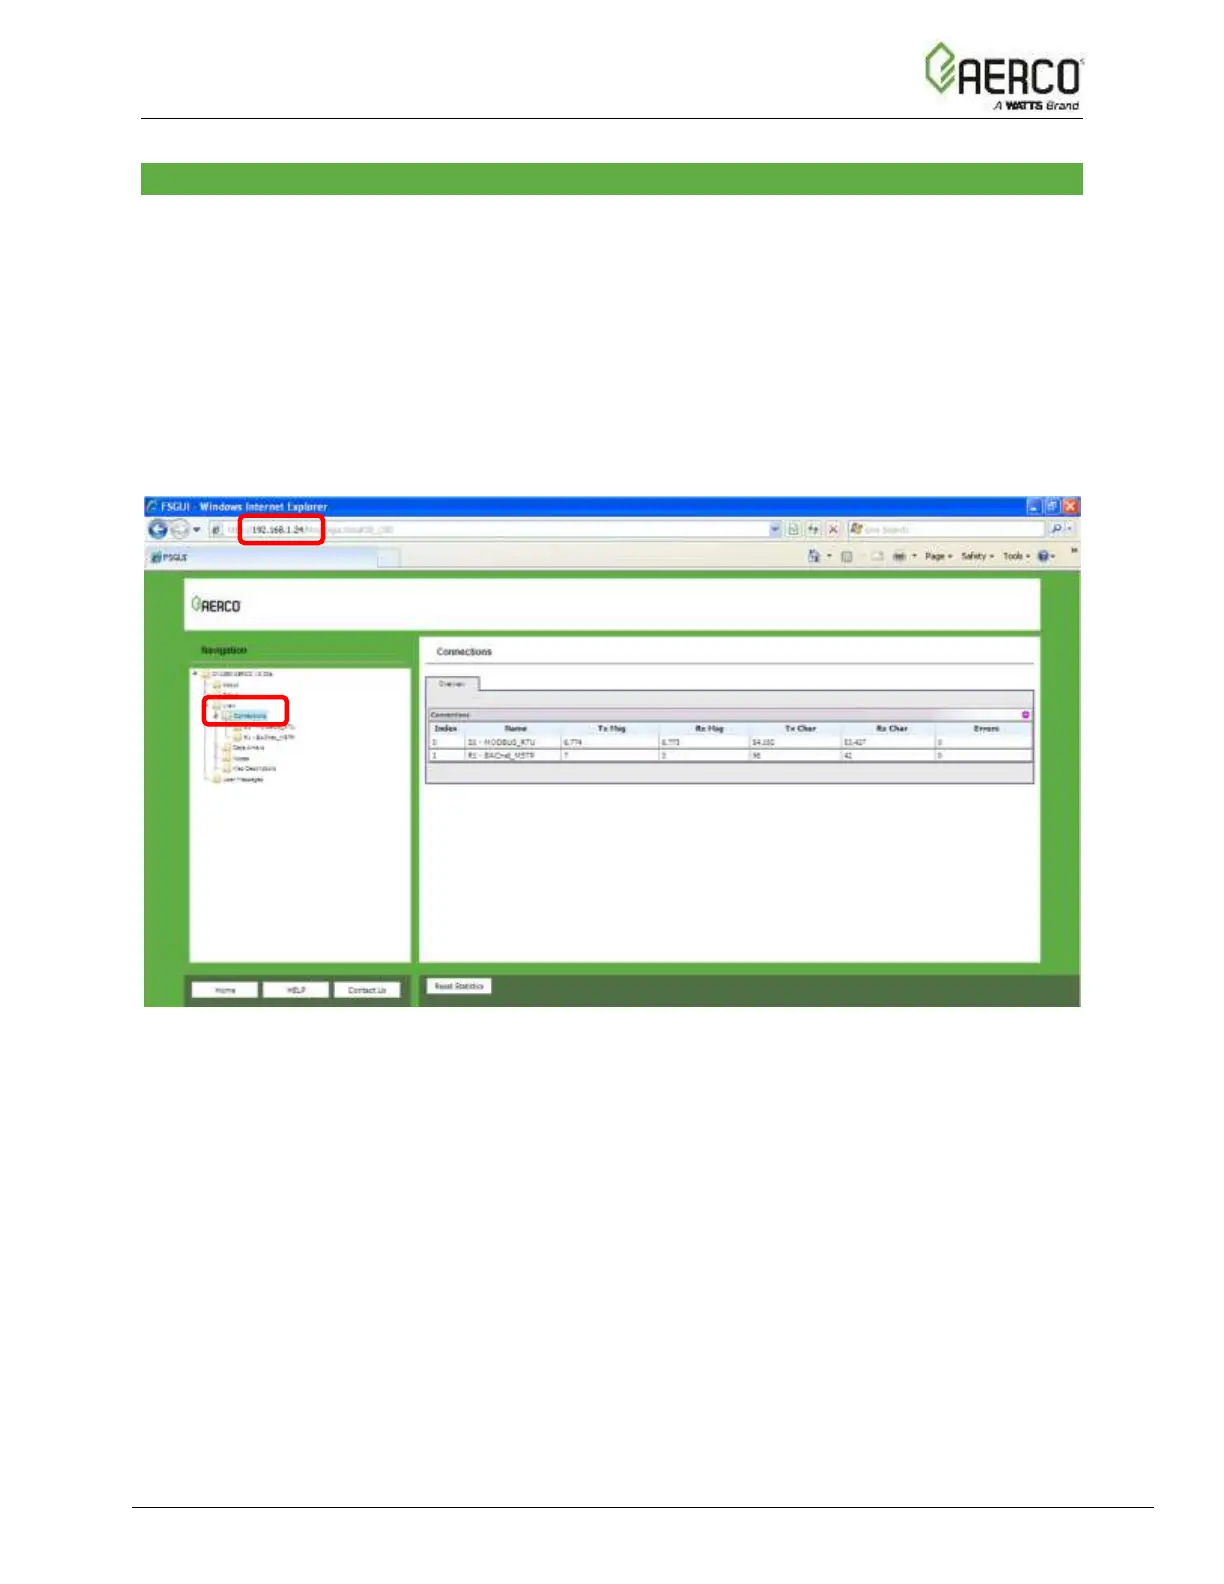
• Click on View and then on click on Connections (see Figure E-1).
Figure E-1: Error Messages Screen
If there are any errors showing on the Connection page, please refer to Appendix E.2, below,
for the relevant wiring and settings.
 Loading...