8 Meadowbank Road, Carrickfergus, BT38 8YF, Northern Ireland www.advancedsensors.co.uk
Page 70 of 93
OIW-HBO-0002-EX-005
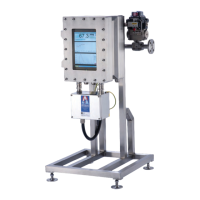
OIW EX SERIES-SIDE STREAM
OPERATION MANUAL
Rev. 004 MAY 2015
Calculating the correct factor from the laboratory results (as standard) and the measurement readings is described with
the following examples. A correction factor is the calculated as the average difference between the laboratory results
and the analyzer measurement readings. Then this average is used as a multiplication factor to calculate the actual
displayed reading allowing the ‘gain’ settings to be adjusted.
A. If the OIW analyzer is measuring LOWER than the lab
Example Results:
Sam
e Difference = 1.46
If the ppm reading = 55
The new adjusted reading should be 55 x 1.46 = 79.7
Now increase the gain to obtain a ppm reading of 79.7.
B. If the OIW analyzer is measuring HIGHER than the Lab
Sam
e Difference = 0.72
If the ppm reading = 55
The new adjusted reading should be 55 x 0.72 = 39.6
Now decrease the gain to obtain a ppm reading of 39.6
NOTE: If an analysed sample shows a very large difference from all the other samples taken, then this
sample should not be included
 Loading...