118
S:\Hp8960\Generic Documents\Manual Operation Getting Started Guide\Pi_manual operation getting started guide\chapters\gprs_man_measurements.fm
GPRS Mobile Measurements
16.Press the Graph (F5) key then the Modulation (F1) key to access the ORFS due
to modulation bar graph.
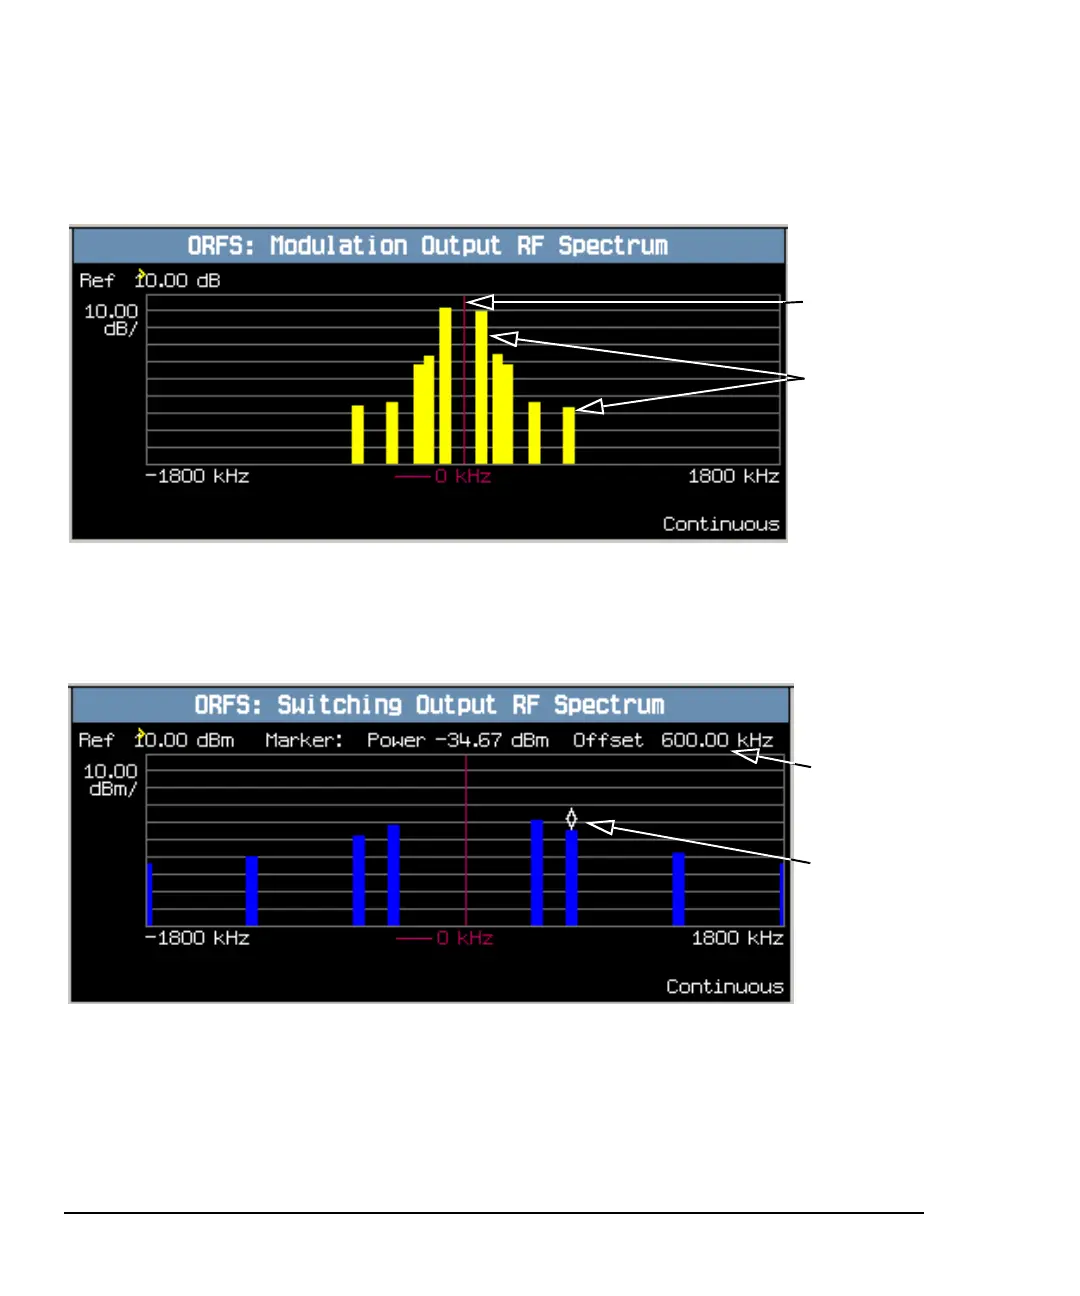
A typical ORFS due to modulation graph is shown above. On the display, the bar
representing each offset is shown in yellow and the center frequency is indicated
by a red vertical line.
17.Press the Switching (
F2) key to access the ORFS due to switching bar graph.
A typical ORFS due to switching graph is shown above. On the display, the bar
representing each offset is shown in blue and the center frequency is indicated by
a red vertical line.
Frequency
offsets
Center
frequency
Marker
signal
level and
offset
frequency
Marker
indicator
 Loading...