145
S:\Hp8960\Generic Documents\Manual Operation Getting Started Guide\Pi_manual operation getting started
GSM Mobile Measurements
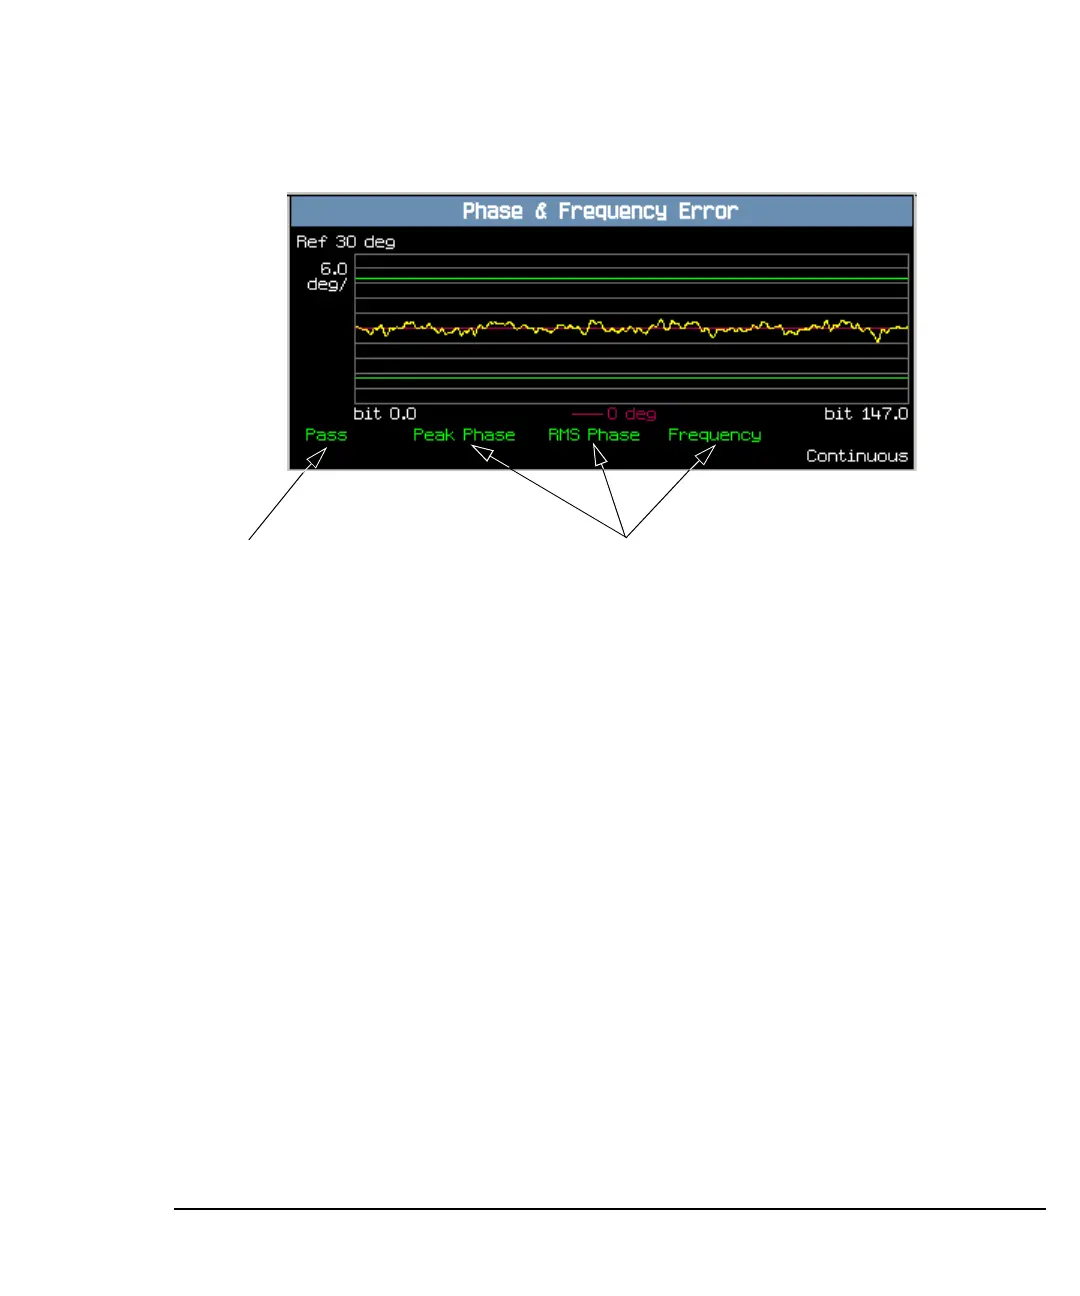
7. Press the Graph (F2) key to access the peak phase error graph.
A typical peak phase error graph is shown above.
Two types of pass/fail results are provided:
• An overall measurement pass/fail indicator is positioned in the bottom left
corner of the display:
— The text “Pass” is shown in a green-colored font if the all of the phase and
frequency error measurements (peak phase error, RMS phase error, and
frequency error) have passed.
— The text “Fail” is shown in a red-colored font if any of the phase and
frequency error measurements have failed.
• Individual pass/fail indicators are provided for the peak phase error, RMS
phase error, and frequency error. On the display, text labels corresponding to
these measurements change color to indicate a pass or fail (green indicates a
pass; red indicates a fail).
Pass/Fail indicators for the peak
phase error, RMS phase error and
frequency error
Overall Pass/Fail
indicator
 Loading...