Circles
Circles
can
either
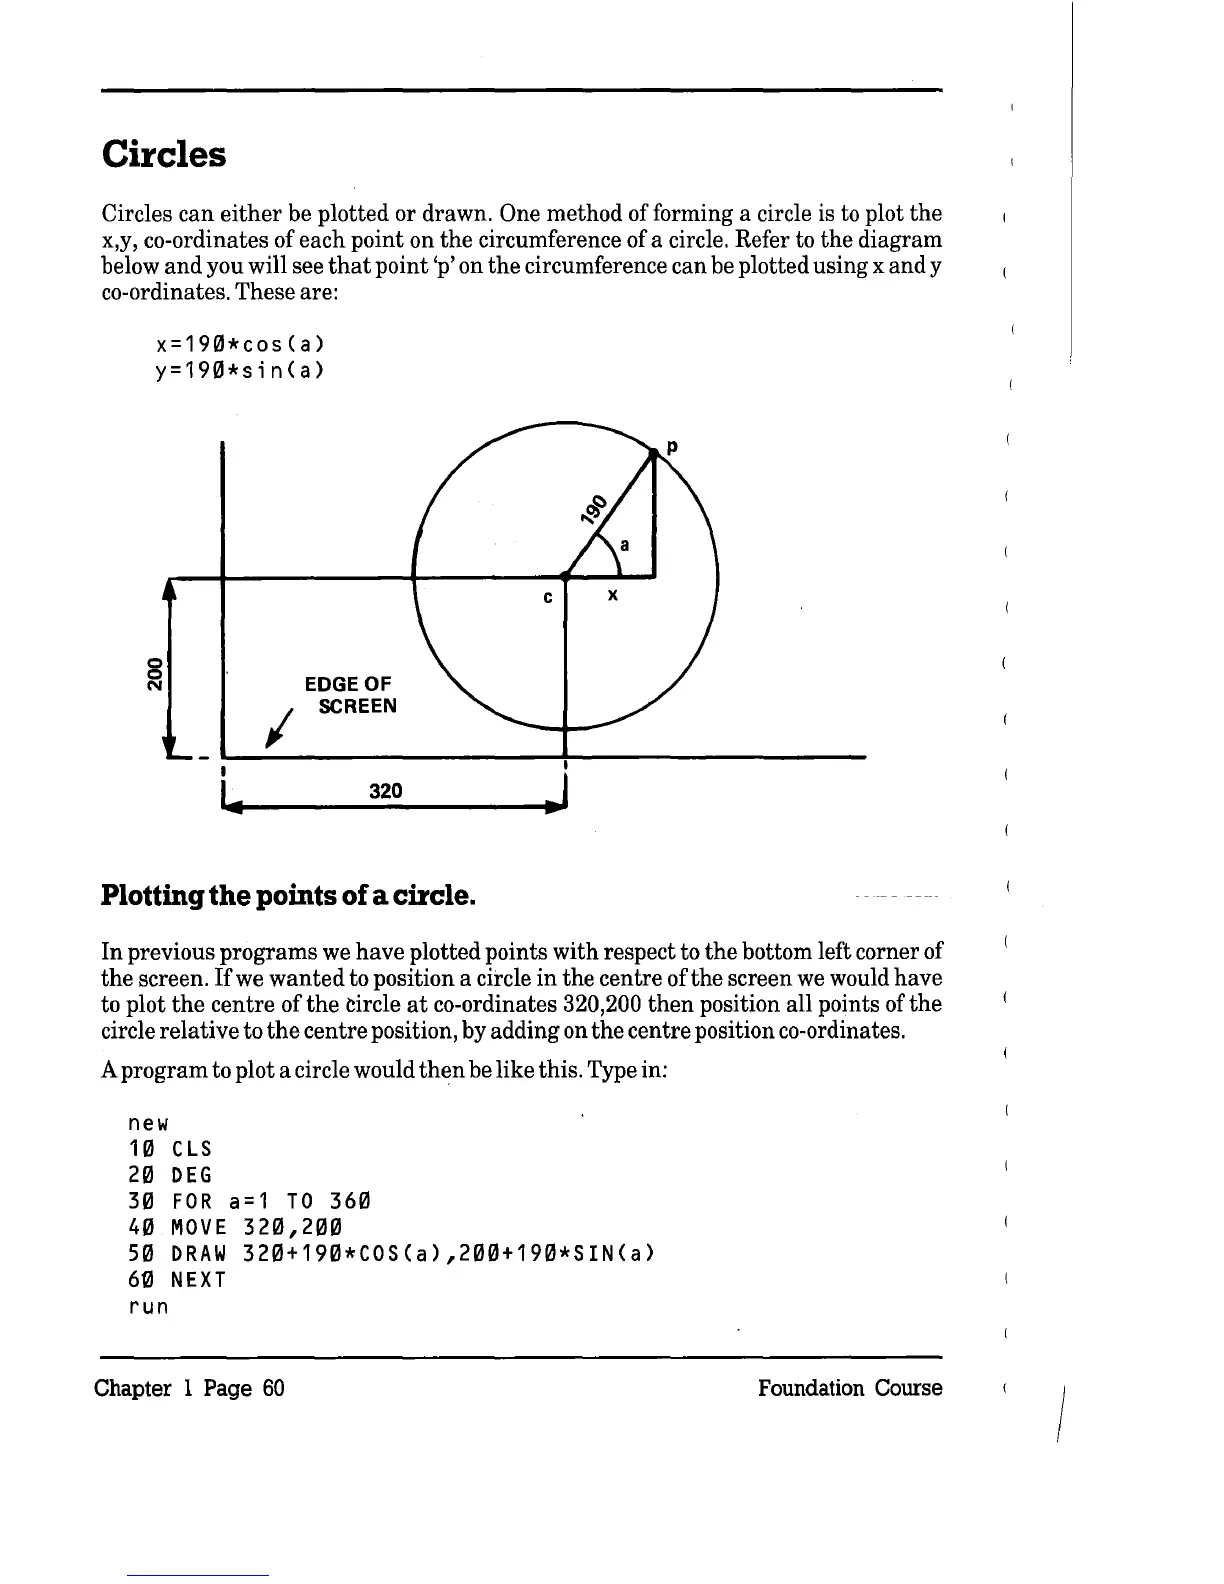
be plotted or drawn. One method of forming a circle is to plot
the
x,y, co-ordinates of each point on
the
circumference of a circle. Refer to
the
diagram
below
and
you will see
that
point 'p' on
the
circumference can be plotted using x
and
y
co-ordinates. These are:
x=19Ql*cos(a)
y=190*sin(a)
8
N
EDGE
OF
I
SCREEN
320
Plotting
the
points
of
a circle.
In
previous programs we
have
plotted points
with
respect to
the
bottom left corner of
the
screen.
Ifwe
wanted
to position a circle
in
the centre of
the
screen we would have
to plot
the
centre of
the
circle
at
co-ordinates 320,200
then
position all points of
the
circle
relative
to
the
centre position, by adding on
the
centre position co-ordinates.
A
program
to plot a circle would
then
be like this. Type in:
new
10
CLS
20
DEG
30
FOR
a=1
TO
360
40
MOVE
320,200
50
DRAW
320+190*COS(a),200+190*SIN(a)
60
NEXT
run
Chapter 1 Page
60
Foundation Course
/
 Loading...