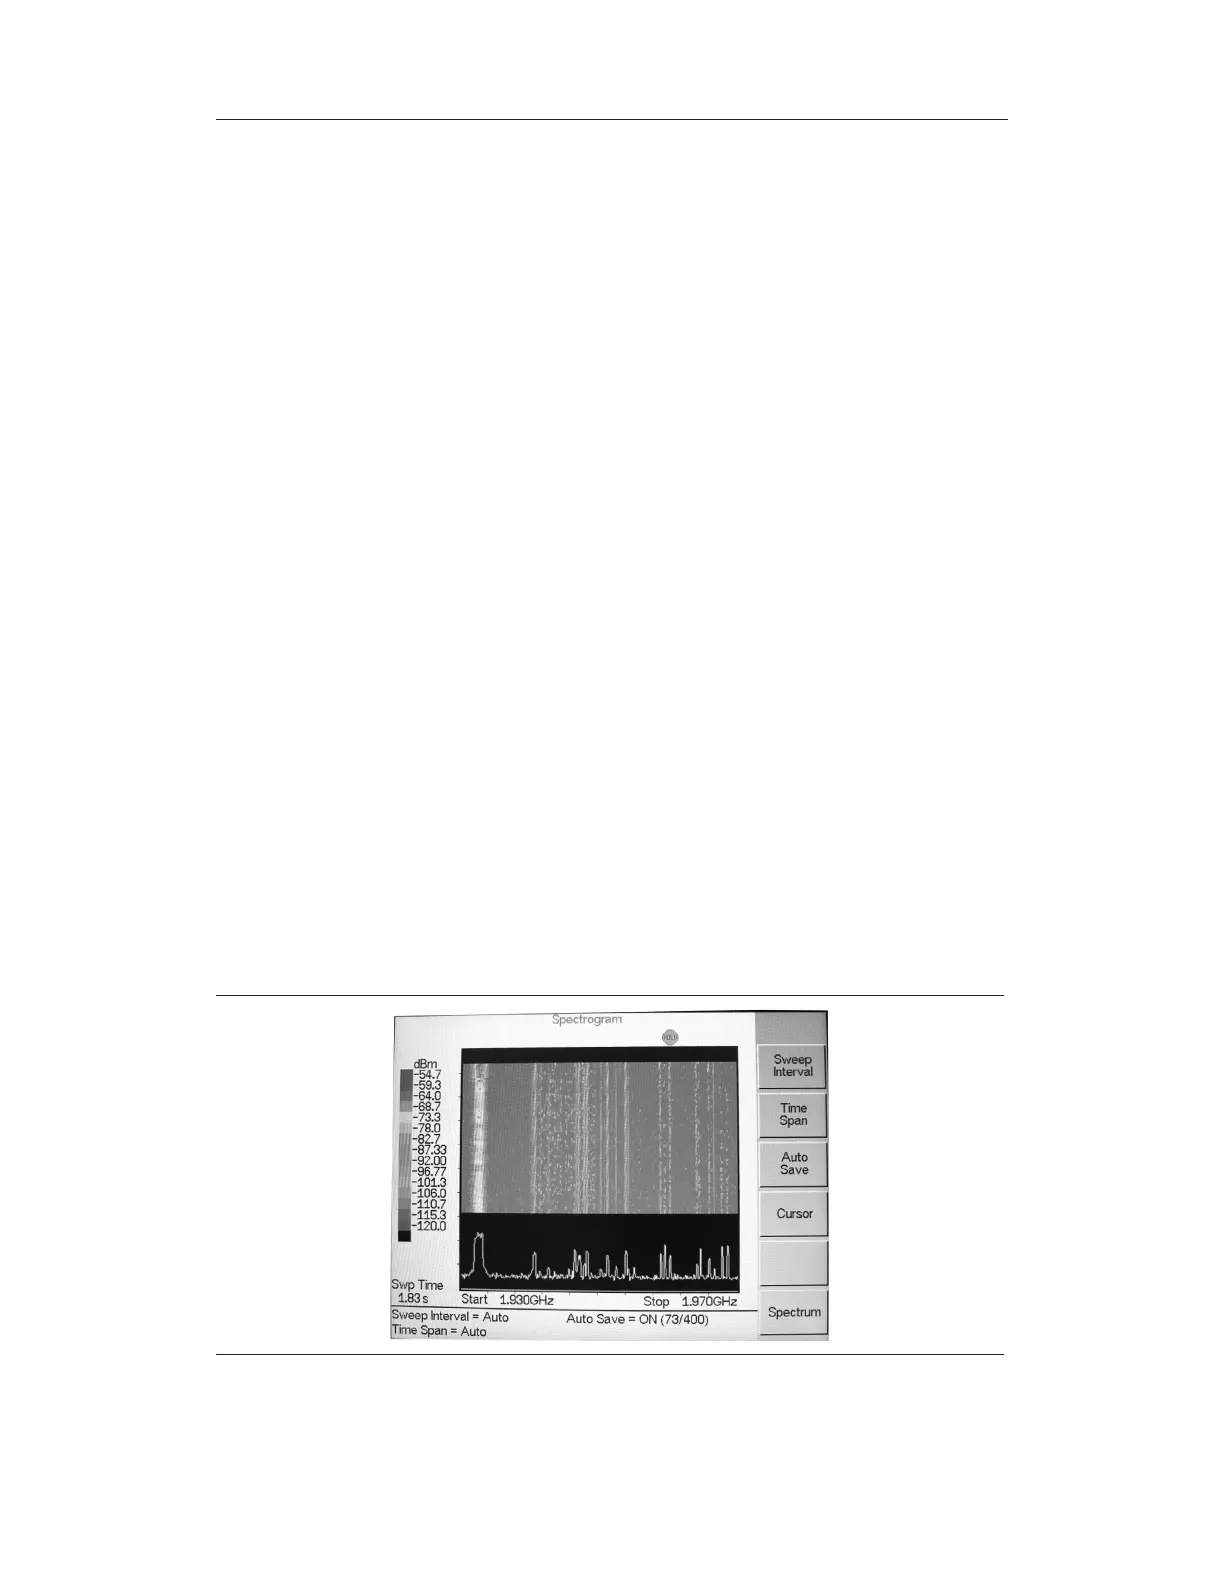
Step 1.
Press the MEAS/DISP key followed by the
Spectrogram soft key to set the
spectrogram sweep parameters. There are two ways to set up spectrogram time
parameters: set the time between sweeps or set the total time for a full spectro
-
gram display.
Step 2. To change the time between sweeps, press the
Sweep Interval soft key and use
the keypad to set the time from 0 seconds to 660 seconds. Entering the time in
-
terval value causes the corresponding time span value to be automatically com
-
puted. The time span can be viewed or changed by selecting the
Time Span soft
key and using the keypad to set the span. As expected, changing the time span
will automatically change the sweep interval.
Step 3. To set the total time span for a complete display, press the
Time Span soft key
and use the keypad to enter a time between 0 and 4320 minutes (72 hours.) En
-
tering a time span value causes the corresponding sweep interval value to be au
-
tomatically computed and shown when the
Sweep Interval soft key is pressed.
Step 4. Spectrogram plots may be automatically saved when the waterfall display is full
by pressing the Auto Save soft key, which toggles between OFF and ON as
shown at the bottom of the screen.
Step 5. There are two cursors that can be used to investigate the frequency and time of
any spot in the spectrogram display. Before using the cursors, press the
RUN/HOLD key to suspend the acquisition of new data to avoid having the
point of interest scroll off the top of the screen. Press the
Cursor soft key to turn
on the time cursor and frequency cursor.
Step 6. Press the
Time Cursor soft key to turn on the horizontal time cursor. Use the
Up/Down arrow key to move the cursor vertically through the spectrogram. The
date and time that the measurement at the cursor position was taken is displayed
in the message area below the graph.
Step 7. Press the
Freq Cursor soft key to turn on the vertical frequency cursor. Use the
Up/Down arrow key to move the cursor through the spectrogram. The frequency
and corresponding amplitude level of the measurement at the cursor position is
displayed in the message area below the graph.
Step 8. Press the
Back soft key to turn off the cursors and return to the previous menu.
13-2
Chapter 13 Interference Analyzer
Figure 13-1. Spectrogram Display