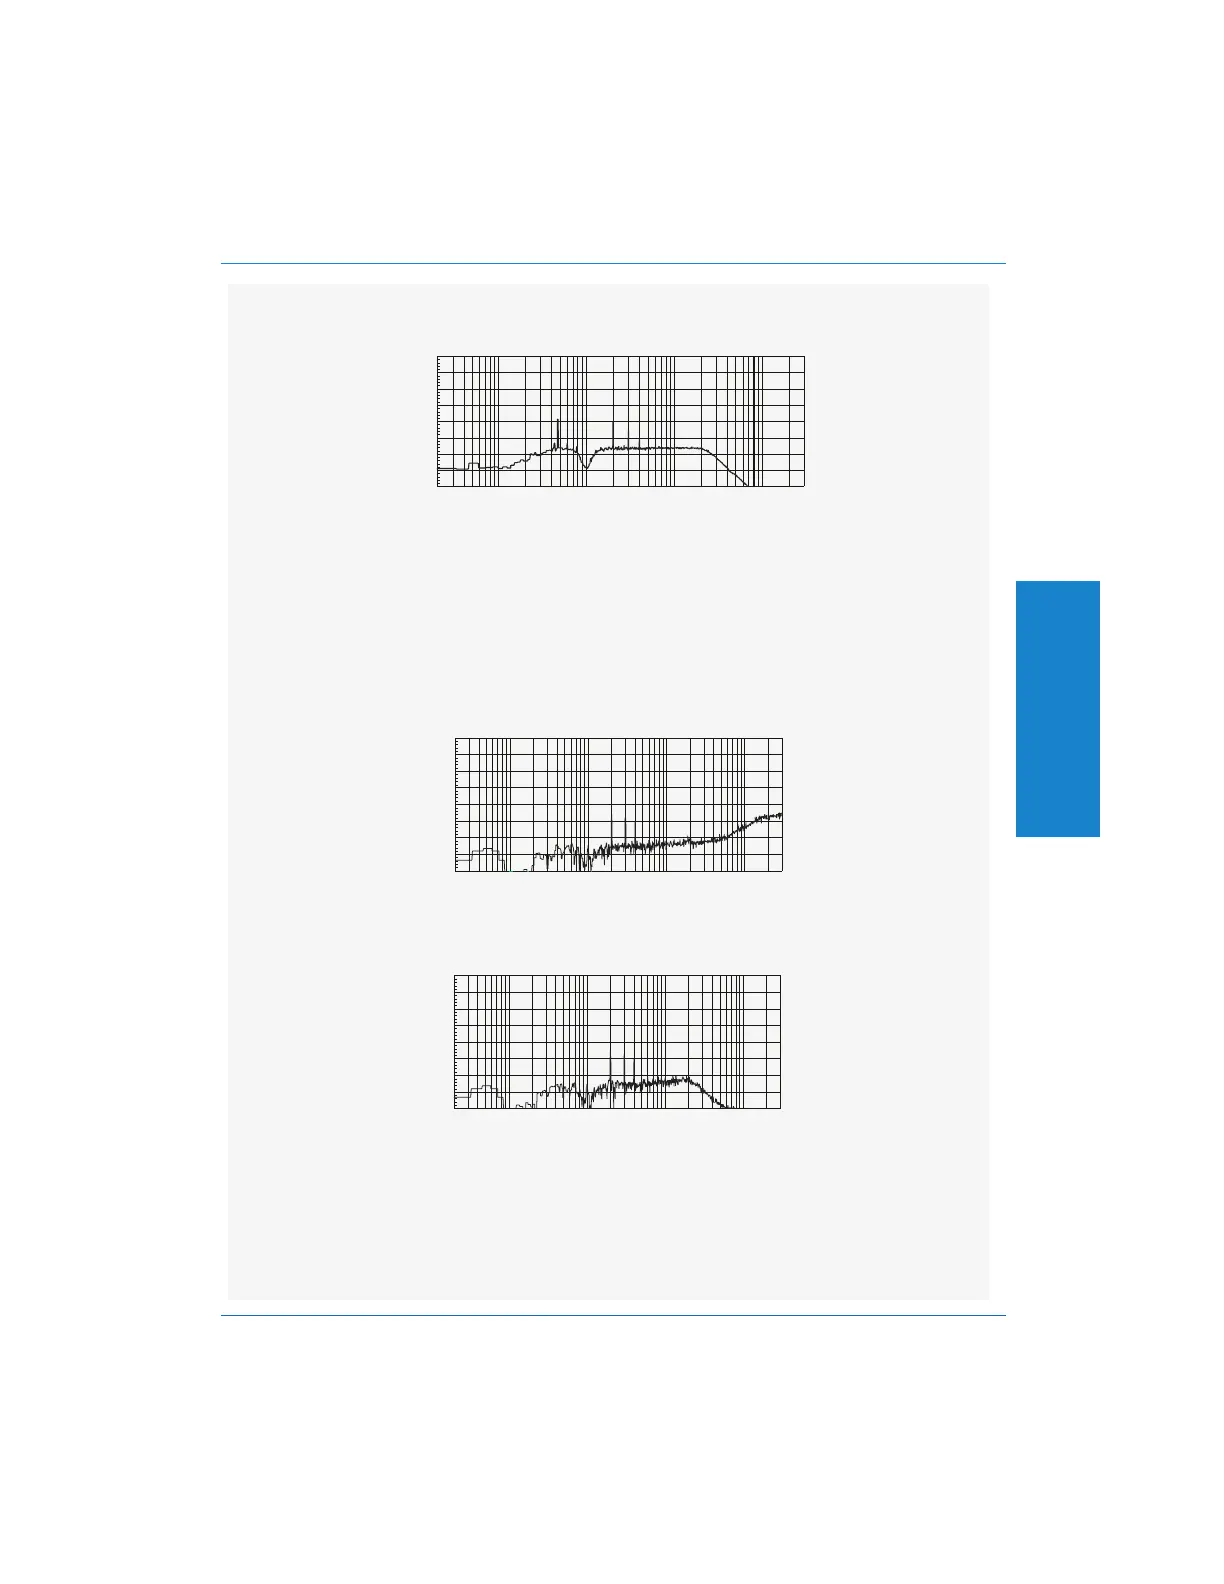
Next, we can invoke the 22 kHz lowpass filter to eliminate the high-frequency noise.
The spectrum now looks like this:
The THD+N still measures 0.185 %. From this, we can determine that (in this
particular case) the high-frequency noise did not make a significant contribution to
the measurement. It is dominated by the distortion and interference tones.
Following is the spectrum of a different THD+N measurement. This one comes
from a device that generates a significant amount of high-frequency noise. The
THD+N measures 0.057 % with a lower band limit of 400 Hz and a high band limit
of >300 kHz. The spectrum is shown after the bandreject filtering, which has
removed the 1 kHz fundamental.
This measurement is dominated by the high-frequency noise, although the distortion
products (at 2 kHz, 3 kHz and 4 kHz) are probably contributing. Next, we can
invoke the 22 kHz lowpass filter. The spectrum then looks like this:
The high-frequency noise has been eliminated, and the measurement is now
dominated by the distortion products. The THD+N now measures 0.0390 %, which
is precisely the theoretical THD for these distortion products. The contribution of the
remaining noise (between 400 Hz and 22 kHz) is negligible.
-140
+20
-120
-100
-80
-60
-40
-20
+0
d
B
r
A
20 50 100 200 500 1k 2k 5k 10k 20k 50k
Hz
200k100k 300k
20 50 100 200 500 1k 2k 5k 10k 20k 50k
Hz
-140
+20
-120
-100
-80
-60
-40
-20
+0
d
B
r
A
100k 200k 300k
-140
+20
-120
-100
-80
-60
-40
-20
+0
d
B
r
A
20 50 100 200 500 1k 2k 5k 10k 20k 50k
Hz
100k 200k 300k
4
Operation
Controlling the Analyzer : THD+N (Total Harmonic Distortion plus Noise) Operation
Portable One Plus Access User's Manual 4-33
Artisan Technology Group - Quality Instrumentation ... Guaranteed | (888) 88-SOURCE | www.artisantg.com