50
USER'S MANUAL
bit One HD /
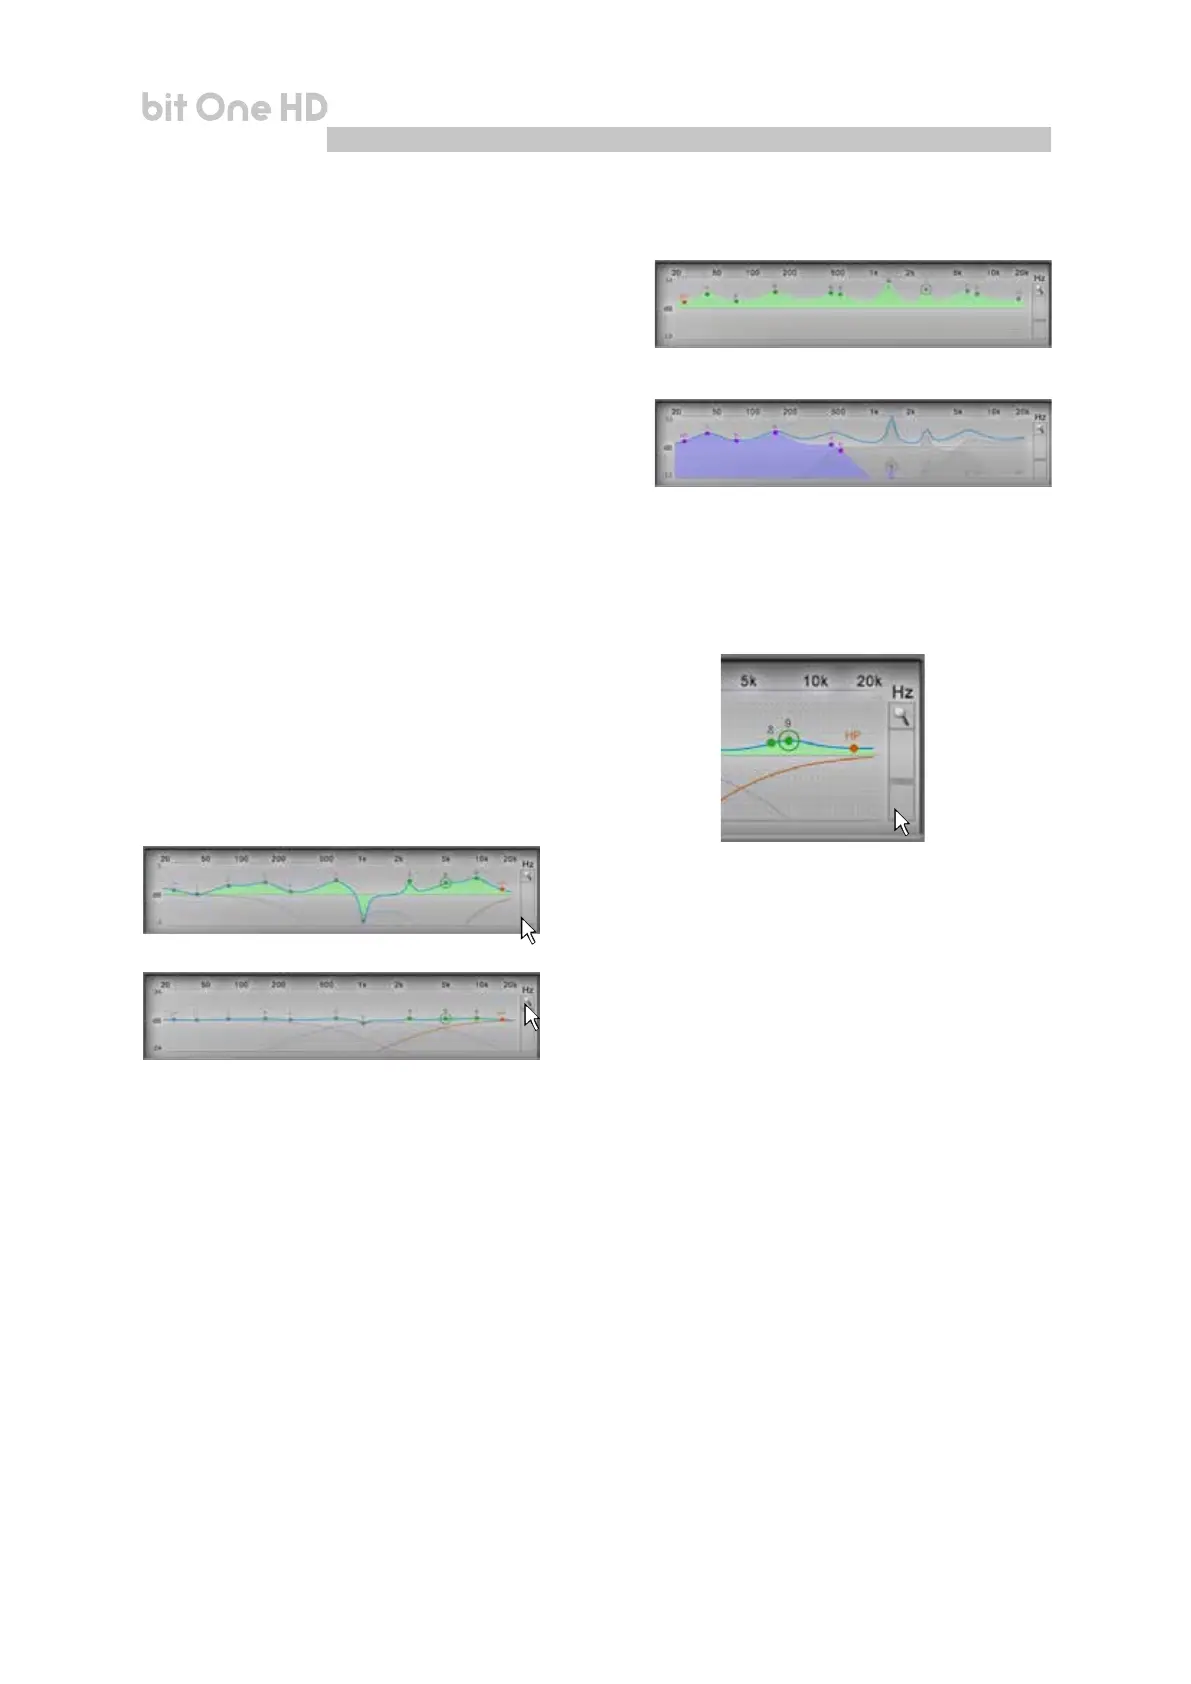
5. EQ: by selecting the box (yellow curve), it allows the
user to see the electric response under equalization
6. SUM: by selecting the box (purple curve), it allows the
user to see the sum of the electric response and the
crossover
7. EQ Off: when activated, it enables the equalizer
de-activation.
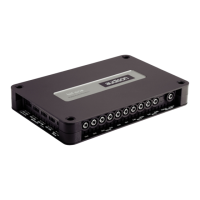
Remark: in order to see the equalization curve set up more
clearly, the vertical scale (dB) can be increased or decreased
by moving the slider located to the right of the diagram
displaying the equalization curve. By default the diagram is
displayed at ± 12dB.
Example of diagram displayed with magnier ± 3dB function
Example of diagram displayed with magnier ± 24dB function
8