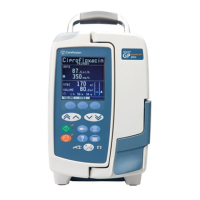
Alaris™ GP (Guardrails™) Volumetric Pump
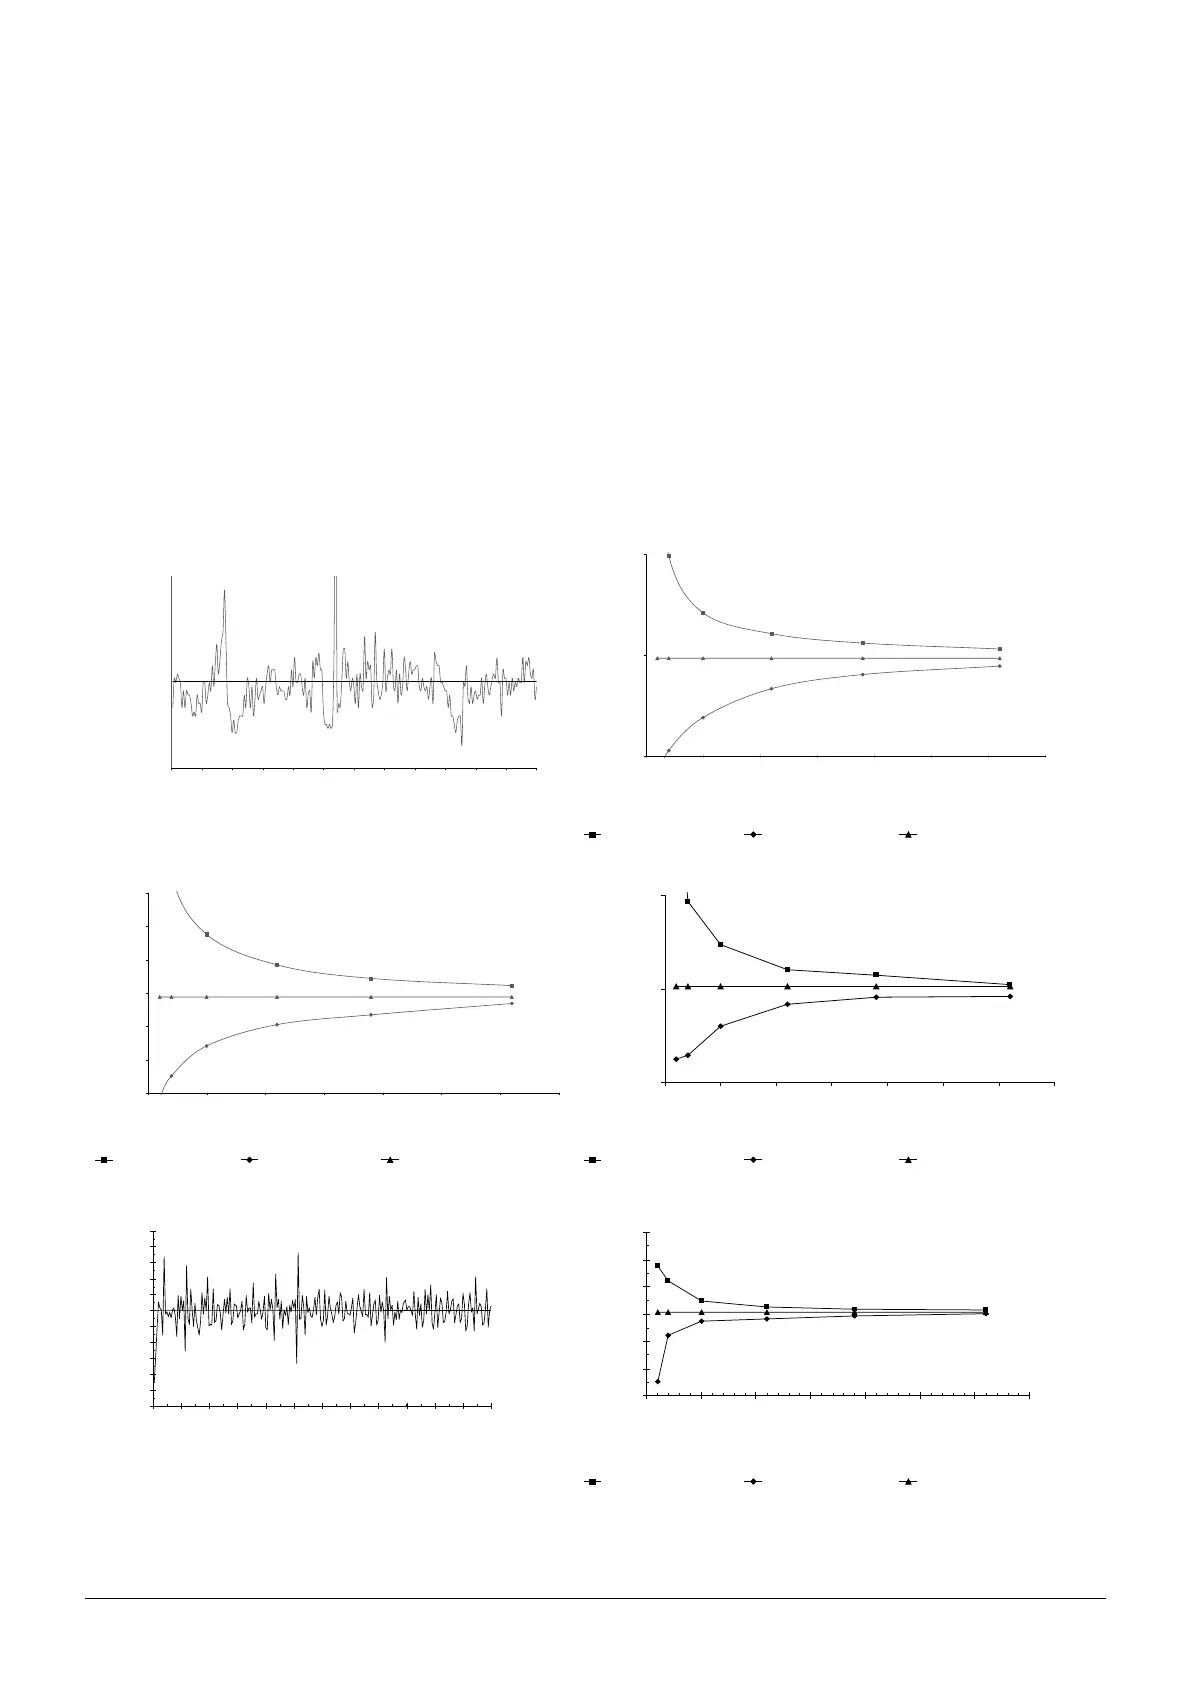
Trumpet and Flow Rate Curves
BDDF00535 Issue 1
53/56
Trumpet and Flow Rate Curves
In this Pump, as with all infusion systems, the action of the pumping mechanism and variations cause short-term fluctuations in rate
accuracy.
The following curves show typical performance of the system in two ways: 1) the accuracy of fluid delivery over various time periods is
measured (trumpet curves), and 2) the delay in onset of fluid flow when infusion commences (start-up curves).
Trumpet curves are named for their characteristic shape. They display discrete data averaged over particular time periods or
'observation windows', not continuous data versus operating time. Over long observation windows, short term fluctuations have little
effect on accuracy as represented by the flat part of the curve. As the observation window is reduced, short term fluctuations have
greater effects as represented by the "mouth" of the trumpet.
Knowledge of system accuracy over various observation windows may be of interest when certain drugs are being administered. Short
term fluctuations in rate accuracy may have clinical impact depending on the half-life of the drug being infused and the degree of inter
vascular integration, the clinical effect cannot be determined from the trumpet curves alone.
The start-up curves represent continuous flow versus operating time for two hours from the start of the infusion. They exhibit the delay
in onset of delivery due to mechanical compliance and provide a visual representation of uniformity. Trumpet curves are derived from
the second hour of this data. Tests performed per IEC/EN60601-2-24 standard.
Start-up Graph at 0.1ml/h (Initial Period) Trumpet Graph at 0.1ml/h (After 24 Hours)
Flow Rate (ml/h)
5
0
5
0.00
0.05
0.10
0.15
0.20
0.25
0.30
0.35
0.40
0102030405060708090100 110120
Error (%)
0
0.00
150.00
0510 15 20 25 30 35
Time (minutes) Observation Window (minutes)
Maximum Error Minimum Error Overall Mean = -5.0%
Trumpet Graph at 0.1ml/h (Initial Period) Trumpet Graph at 0.1ml/h (After 72 Hours)
Error (%)
-50
0
50
100
Error (%)
-15 0.0
0.0
15 0.0
0 5 10 15 20 25 30 35
Observation Window (minutes) Observation Window (minutes)
Maximum Error Minimum Error Overall Mean = -6.0% Maximum Error Minimum Error Overall Mean = 4.0%
Start-up Graph at 1.0ml/h (Initial Period) Trumpet Graph at 1.0ml/h (After 24 Hours)
Flow Rate (ml/h)
Start-up Graph at 1.0 ml/h (Initial Period)
.2
0.0
0.2
0.4
0.6
0.8
1.0
1.2
1.4
1.6
1.8
2.0
0102030405060708090 100 110 120
Error (%)
Trumpet Graph at 1.0 ml/h (After 24 Hours)
-30
-20
-10
0
10
20
30
0510 15 20 25 30 35
Time (minutes) Observation Window (minutes)
Maximum Error Minimum Error Overall Mean = 0.7%
Note: The typical flow rate and trumpet curves are achieved using a recommended infusion set.
The plot range has been increased to ± 150%, to allow visualization of the graph.