Bio-Well Company
www.bio-well.com
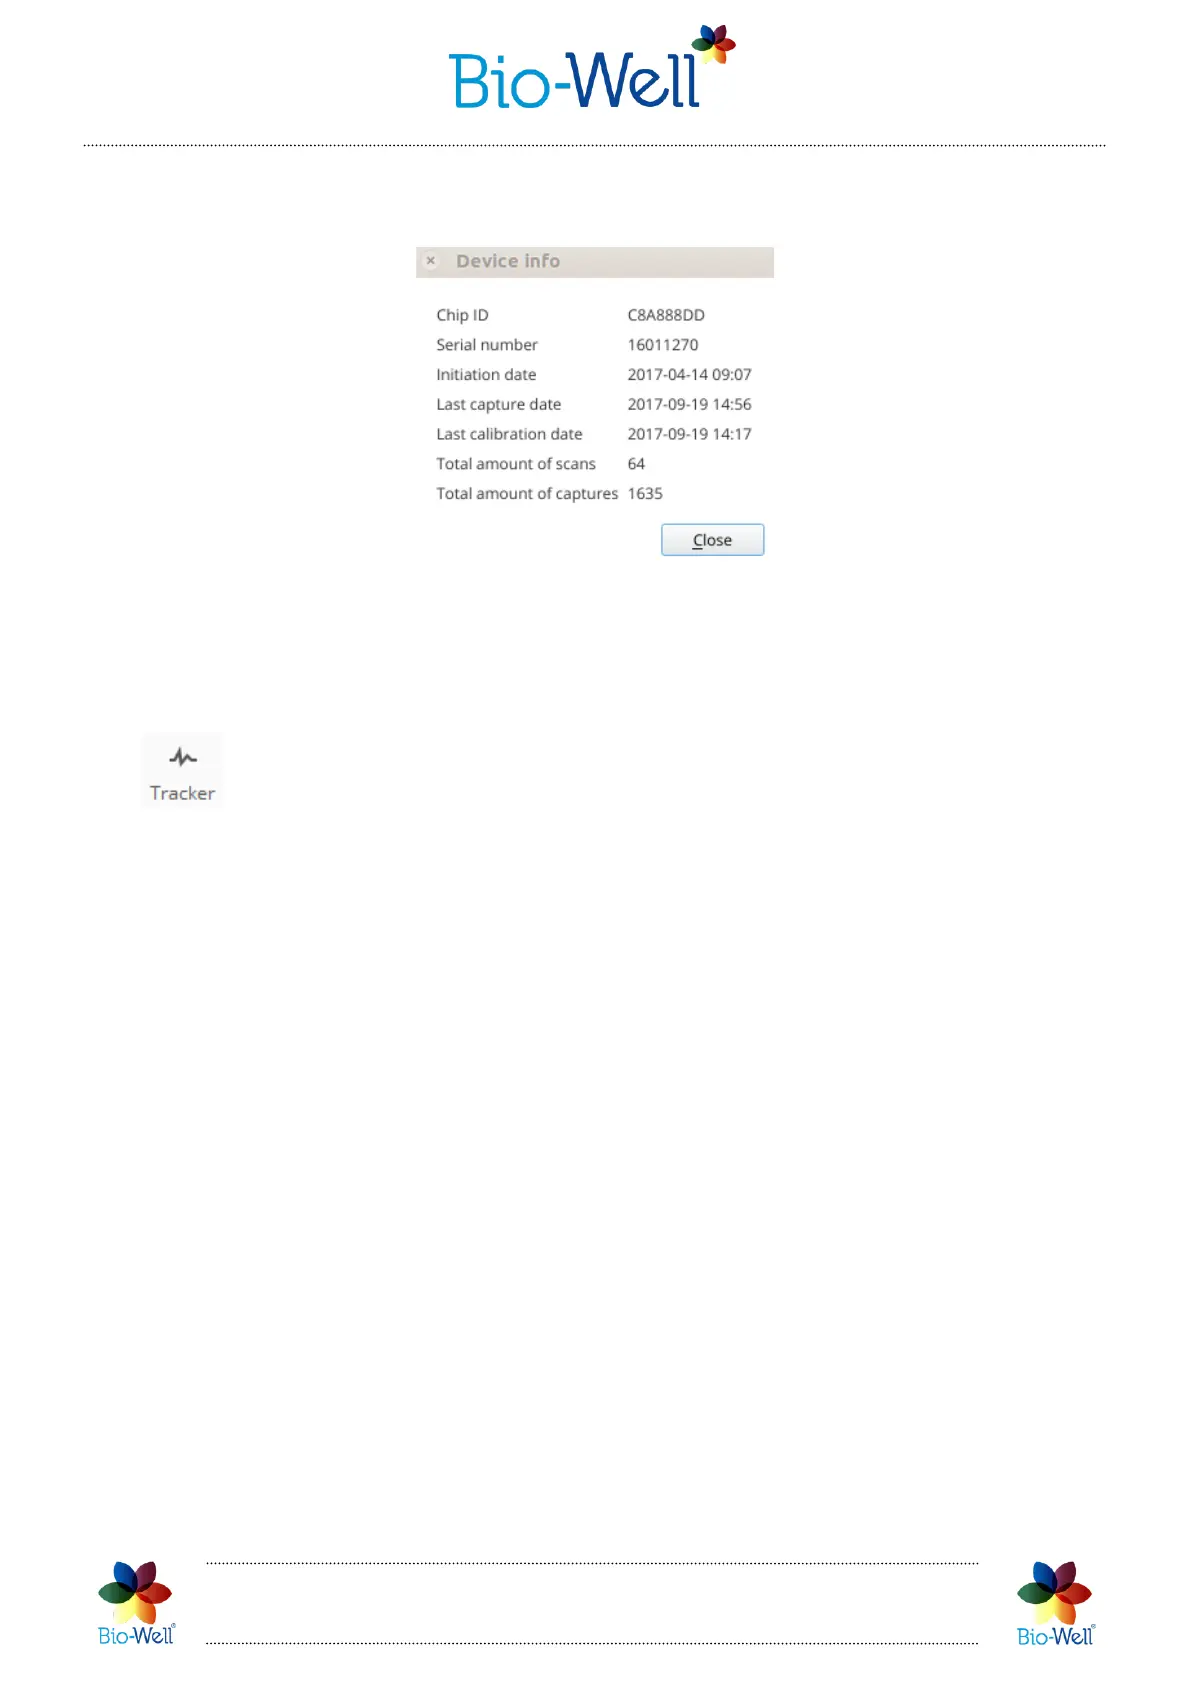
Click the “i” button in the top right corner to see the technical information about
the connected Bio-Well GDV Camera device:
Pic. 9. Technical information window.
When the calibration procedure is finished you will see the pop-up window with
notification “Calibration complete” where you should click “OK”, and you will be
automatically redirected to the Database screen.
- subprogram that combines biorhythms with the Stress and Energy values
for selected card (person). Once you click on the Tracker button you will see the list of
all the Cards in your database. Select the Card for which you want to see the graph of
Energy and Stress changes within time. Once the Card is selected you will see the
following graph -Pic. 9.1.
This graph can show either Energy, either Stress values of all tests made for the
selected Card within selected period of time. You can specify the time period by clicking
on the starting and ending dates. It is possible to calculate the biorhythms up to 2 years
upfront.
In order to see the biorhythms on these graphs you have to specify the date of
birth. See the chapter devoted to biorhythms for more information.
Tracker program allows you to see if there is a correlation between the
Energy/Stress values and biorhythms of this given person, and also to track the
changes of these two main parameters on a long distance in a more convenient way (in
comparison with the Compare function).
 Loading...