___________________________________________________________________
Issue 02 - 04/2004 Libra S21/S22, English 11
Standard Curve (2.4)
The construction of a multi point calibration curve from standards of known
concentration in order to quantify unknown samples is a fundamental use of a
spectrophotometer; a common example is the Bradford determination for proteins. This
instrument has the advantage of being able to store this curve as a method. The
procedure to construct the standard curve is as follows:
• Press Standards (F3) followed by New (F1) and confirm (F3)
[this step is not necessary if this mode is being used for the first time]
• Enter appropriate wavelength and press OK (F3)
• Select Curve Fit method; Single Point (1), Linear Regression (2) or Linear
Interpolation (3)
• Enter number of standards (2-12) and press OK (F3)
• Enter number of replicates (1-3) and press OK (F3)
• Enter concentration of first standard and press (F3)
• To include a zero concentration standard, include this in the number of
standards to be entered and enter 0.00 for concentration; use a blank when
required to enter standard 1
• Enter concentrations of other standards as prompted
• Insert reference and press green run key
• This reference value is used for subsequent samples until changed
• Insert standards as required and press followed by OK (F3), repeating as
necessary to construct the standard curve. Values can be written down if required.
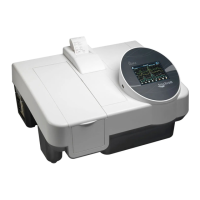
• Press Standards (F3) to see the standard curve, press OK (F3) to return
• If in linear regression mode, the values for the slope, intercept and coefficient
of determination are printed out
• Insert reference and press green run key
• This reference value is used for subsequent samples until changed
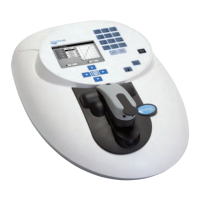
• Insert samples as required and press (repeat as necessary)
• To go back and change the parameters press Method (F1)