D2 PHASER User Manual
DOC-M88-EXX141 V5 – 01.2015 29
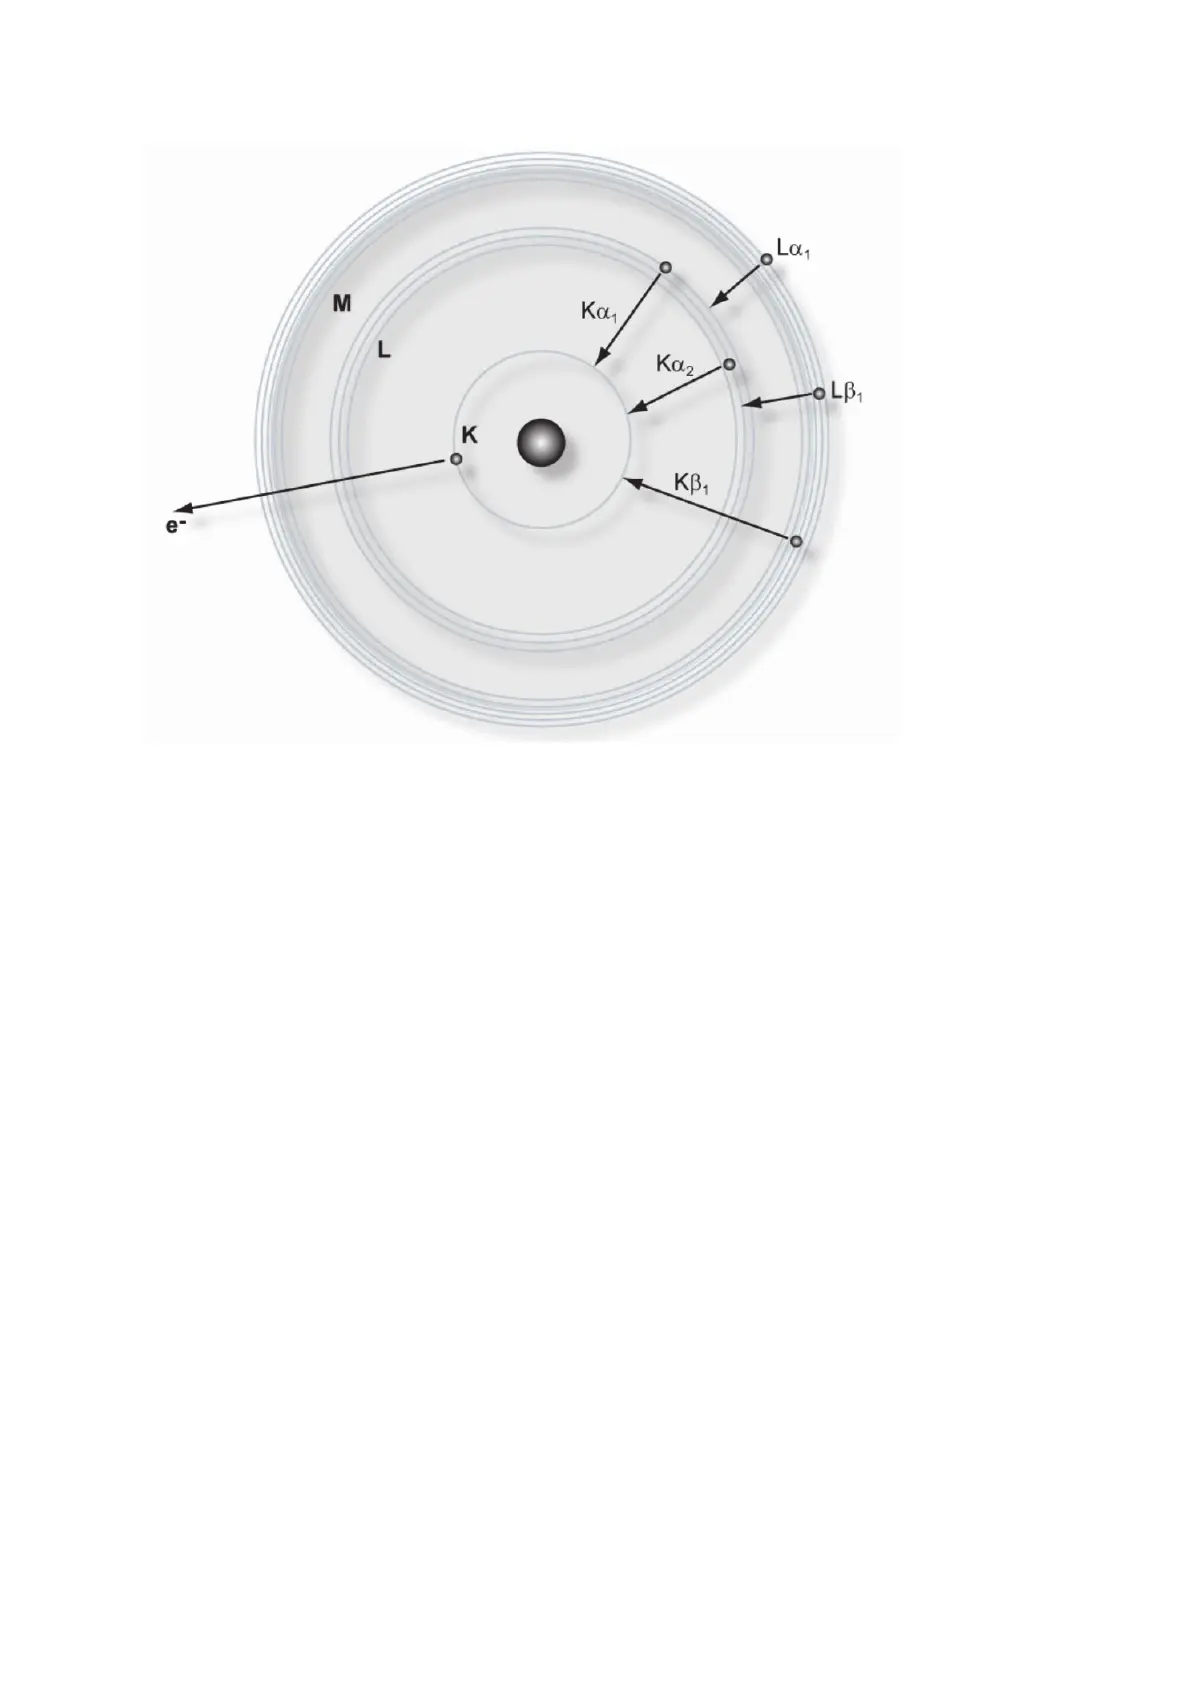
Fig. d: Subshells and their transferred electrons.
In Fig. e below, the wavelength distribution of both continuous and characteristic radiation is shown as
a function of intensity or the number of pulse counts per second. The characteristic peaks Kα
1
, Ka
2
and Kβ
1
are clearly visible above the continuous spectrum.
The point on the wavelength scale at which the continuous spectrum begins is known as the short
wavelength limit (SWL) and corresponds to the radiation produced by the electrons that give up all
their energy on the initial impact. Thus for a particular supply voltage, these electrons give rise to
photons of maximum energy (minimum wavelength).
With an increase in supply voltage, the SWL as well as the point of maximum intensity of the
continuous spectrum moves down the wavelength scale. In other words, an increase in operating
potential produces a shift of the continuous spectrum in the direction of lower wavelengths and higher
energy. On the other hand, the characteristic spectrum, because it is characteristic of the anode metal,
merely undergoes an increase in intensity (pulse count rate).