40
CHAPTER
2 Manual Operations
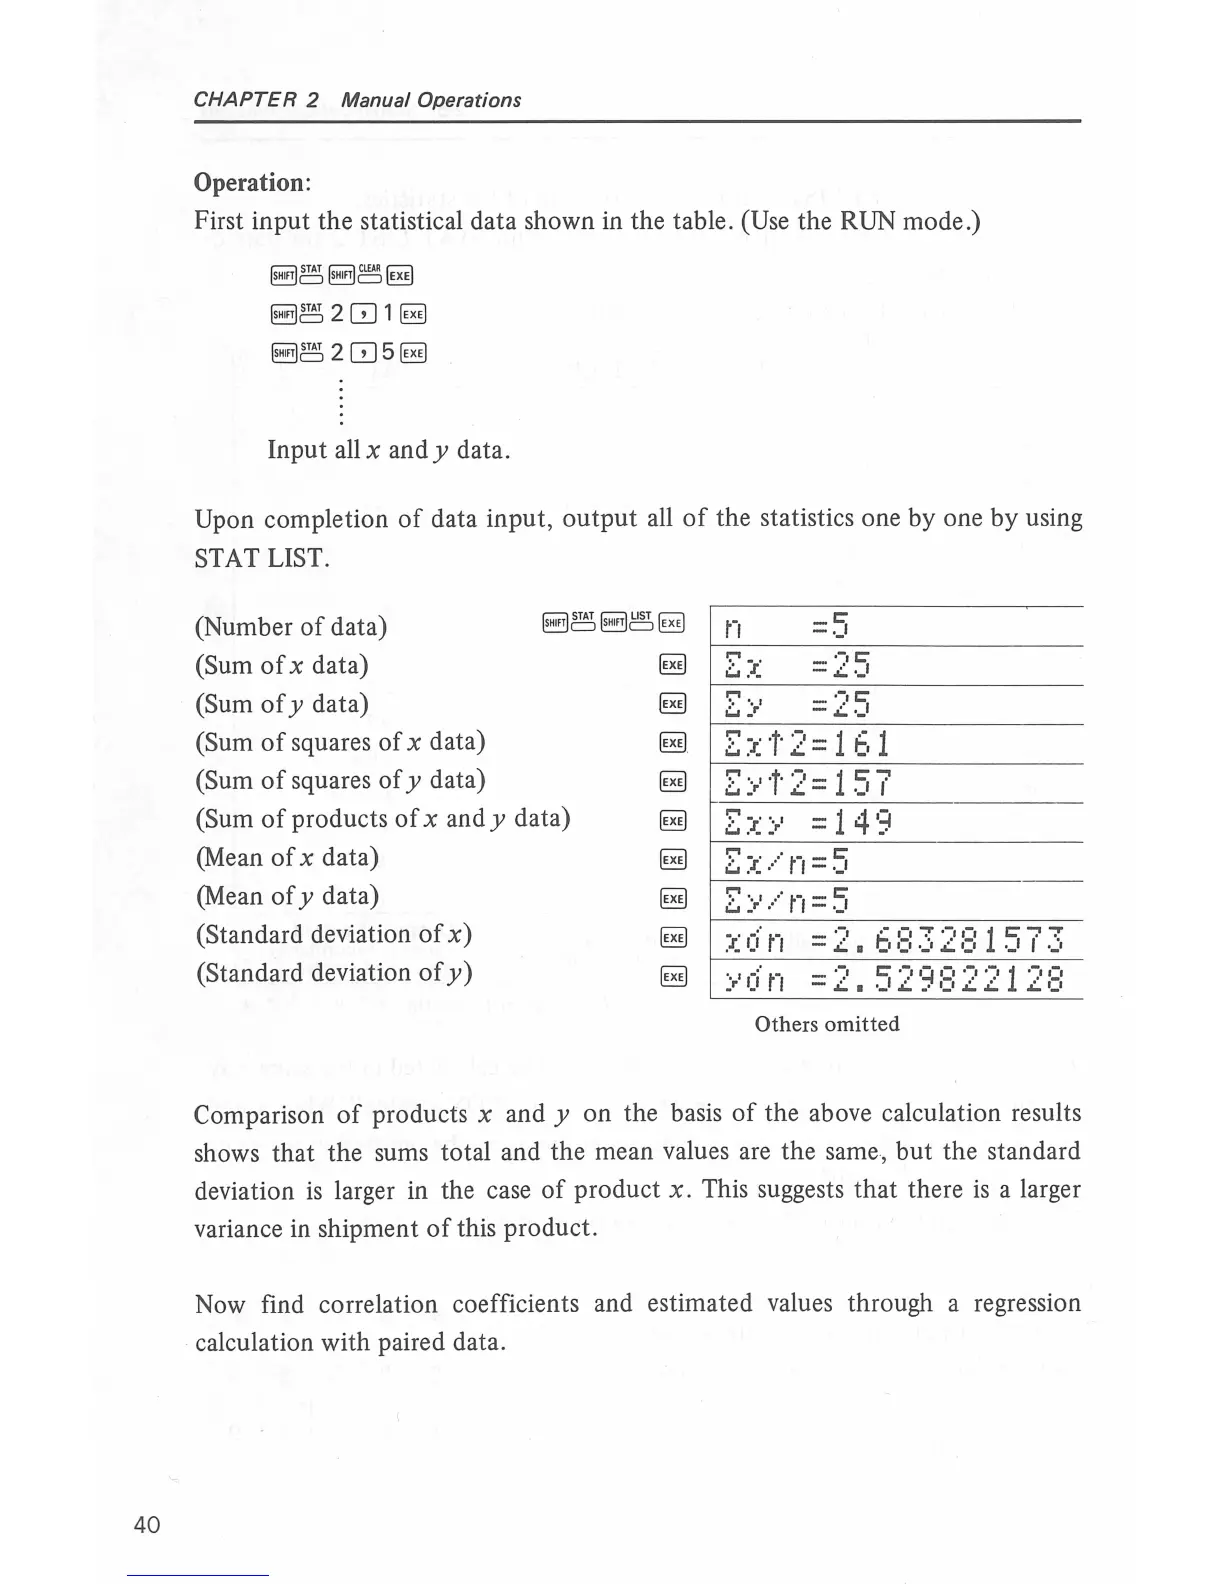
Operation:
First input the statistical data shown in the table. (Use the RUN mode.)
Input
allx
andy
data.
Upon completion
of
data input,
output
all
of
the statistics one by one
by
using
STAT LIST.
(Number
of
data)
(Sum
of
x data)
~~~~~
r1
=5
(Sum
of
y data)
(Sum
of
squares
of
x data)
(Sum
of
squares
of
y data)
(Sum
of
products
of
x and y data)
(Mean
ofx
data)
(Mean
of
y data)
(Standard deviation
of
x)
(Standa
rd
deviation
of
y)
f--~~
~~~~~~
~
~~-
~
:Ex
=25
- ·-:1C'
- .:.,._I
:::r~l2
=
161
'=:"'·.i·r
· ·
-:
·-1 C'...,
~
..
r
..:..
- ·-'I
';."'-
..
.. -
14q
'-'.I
..
..
r - .. •
:::r~/n=5
ZY/n=5
r;:::)
•
..·
·
..
.
-,
C'
.-.
,_,-
,- , .
-,
.
-.
1
.-.
,-,
~
)
1
1.J
t I = L •
._1
.a::.
..
·
1:1
L
.L
L
•:•
Others
omitted
Comparison
of
products x and y
on
the basis
of
the above calculation results
shows that
th
e sums total and the mean values are the same,
but
the standard
deviation
is
larger in the case
of
product x . This suggests that there
is
a larger
variance in shipment
of
this product.
Now find correlation coefficients and estimated values through a regression
calculation with paired data.