2-5 Statistical Calculations
Exercise:
The table below shows
the
ratios
of
advertising expenditure (advertising expendi-
ture/operating expenses) and the ratios
of
operating profit (operating profit/sales
amount)
in seven chain supermarkets last year.
Was
advertising effective?
~ore
1
2 3 4
Ratio
of
advertising
expenditure(
%)
0.8
2.1 2.5
1.8
Ratio
of
operating
profit
(%)
2.5 3.4 3.7
3.2
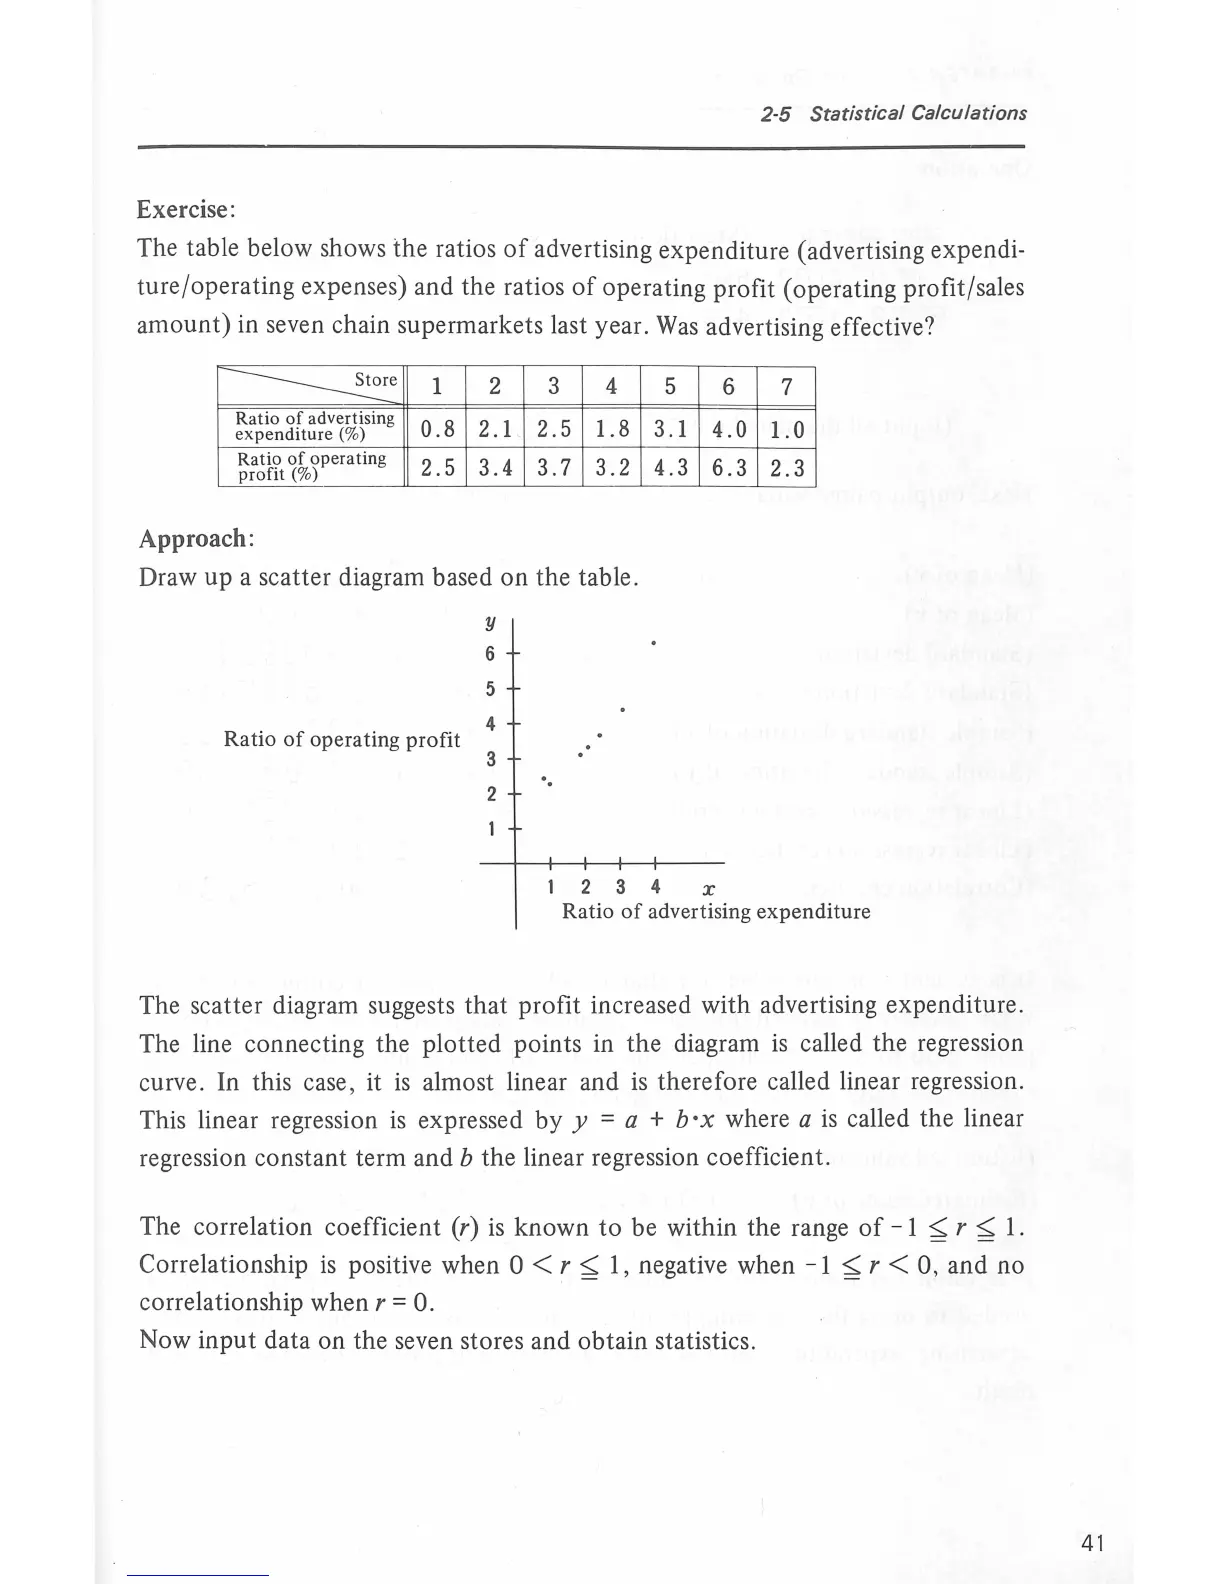
Approach:
Draw
up
a scatter diagram based
on
the
table.
y
6
5
.·
Ratio
of
operating profit
3
4
2
·.
5 6
3.1
4.0
4.3
6.3
2 3 4 x
7
1.0
2.3
Ratio
of
advertising ex
penditur
e
The scatter diagram suggests
that
profit increased
with
advertising expenditure.
The line connecting the
plotted
points in
the
diagram
is
called the regression
curve. In this case,
it
is
almost linear and is therefore called linear regression.
This linear regression
is
expressed
by
y = a + b · x where a is called the linear
regression constant term and
b the linear regression coefficie
nt.
The correlation coefficient
(r)
is
known
to
be within the range
of
- I
~
r
~
I.
Correlationship is positive when 0 < r
~
I , negative when - I
~
r <
0,
and
no
correlationship when r = 0.
Now
input
data
on
the seven stores and
obtain
statistics.
41