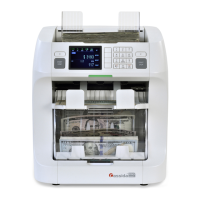
CassidaPRO Zeus: Service Manual
2018 Cassida Corporation. All rights reserved.
Rev: 09/05/2018
cassidapro.com/partner/
are speeding up and slowing down.
• PS1L - BLUE - Left upper position sensor. This is the first
position sensor along the bill path that notes when a bill has been
passed towards the CIS.
• PS1R - RED - Right upper position sensor. Paired with the left
sensor above, this is the second location sensor in the upper path.
• PS2L - BLUE - Left lower position sensor. This detects the
location of a note after it has passed the CIS sensor.
• PS2R - RED - Right lower position sensor. This is paired with
the left lower sensor at the end of the bill transport path.
• NPM - YELLOW - Notes Per Minute graph. This is the average
number of notes per minute passed through the unit. Note that this
is truly an average, as the Zeus unit will vary speeds to minimize
motor effort while maintaining a constant average number of
notes per minute.
[4] Scanned Images
• Pressing [4] displays the captured image from the last bill through the
transport path. Using newer series bills or high denomination bills, the
technician is able to view the security features of the bill and diagnose
CIS, IR, and UV sensor errors. The first screen displays 4 quadrants:
• RGB - Color image captured by the CIS sensor. Irregularities
in this image are indicative of CIS pixel issues or possible sensor
problems. Inspect the ribbon cable for damage, the sensor for
debris or cracks, or the main board for rendering issues.
• IR R - Reflected Infrared Scan Image. This image will show IR
stripes. If the image is dark or missing, this points to an issue with
the IR illumination bar, the cable to the IR illuminator, or the main
board.
• IR T - Transmitted Infrared Scan Image. This is a through-scan
image of the note that will clearly display watermarks, security
threads, and other IR features. If this image is dark or missing, this
points to an IR illuminator issue, flat cable issue, or main board
problem.
• UV T - Transmitted Ultraviolet Image. This is usually the darkest
of the captured image. Use this to view watermarks, security
thread, and UV features. If this image is dark or missing, inspect
the UV illuminator bar for cracking, debris, damage to the cable,
or the main board for rendering issues. Pressing [4] repeatedly
will show higher resolution images of each scanning technique,
and a histogram of the color/shading captured. Use the
histogram to check for low or abnormal responses.
[5] UV, IR and RGB Detail
• Pressing [5] will cycle through the detailed UV, IR, and RGB
throughput information.
• RGB IR - This image displays the per-pixel values of each
portion of the full illumination bar. Note any flat areas, or
DIAGNOSIS 6.2.

 Loading...