xStack DES-3528 Series Layer 2 Stackable Fast Ethernet Managed Switch User Manual
Errors
The Web Manager allows port error statistics compiled by the Switch's management agent to be viewed as either a
line graph or a table. Four windows are offered.
Received (RX)
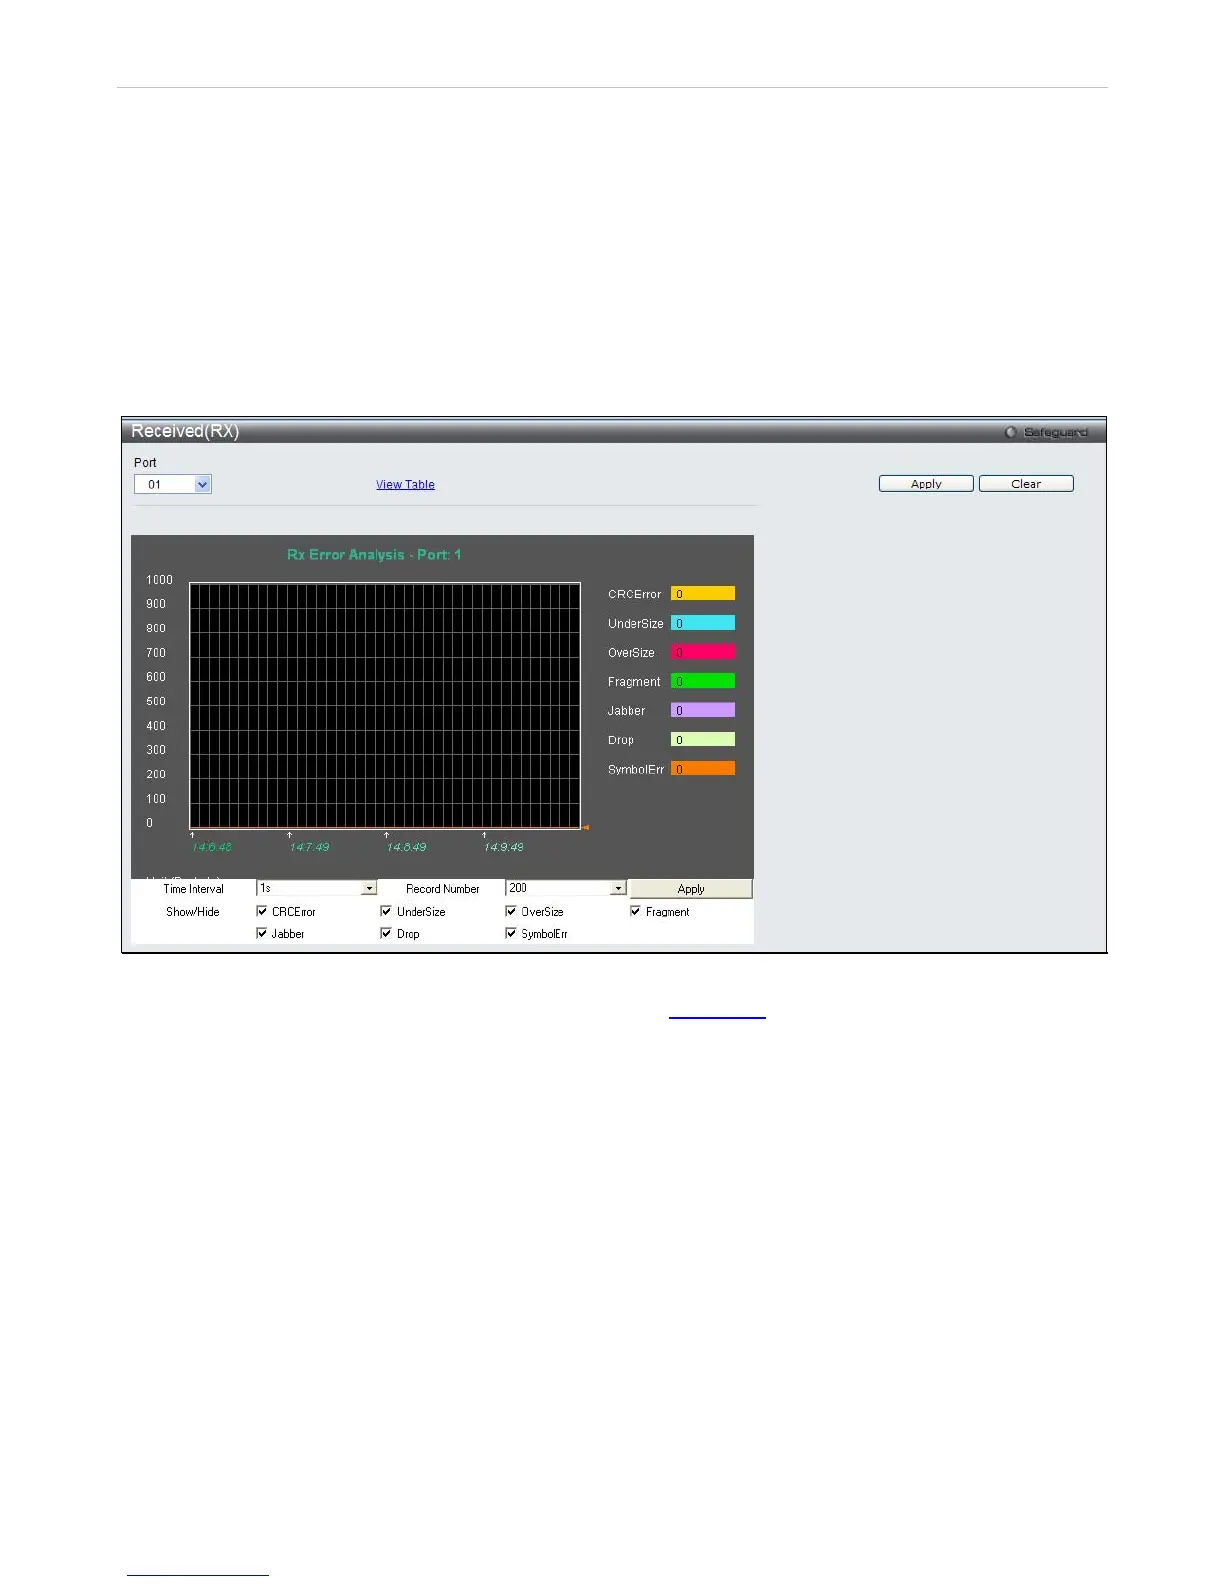
To select a port to view these statistics for, select the port by using the Port pull-down menu. The user may also use
the real-time graphic of the Switch at the top of the web page by simply clicking on a port.
To view the following graph of error packets received on the Switch Click Monitoring > Errors > Received (RX).
Figure 11- 1 . Received (RX) window (for errors) 2
To view the Received (RX) Table window for errors, click the link View Table
, which will show the following table:
216