Monitoring > Statistics
The Statistics screen displays the status of each port packet count.
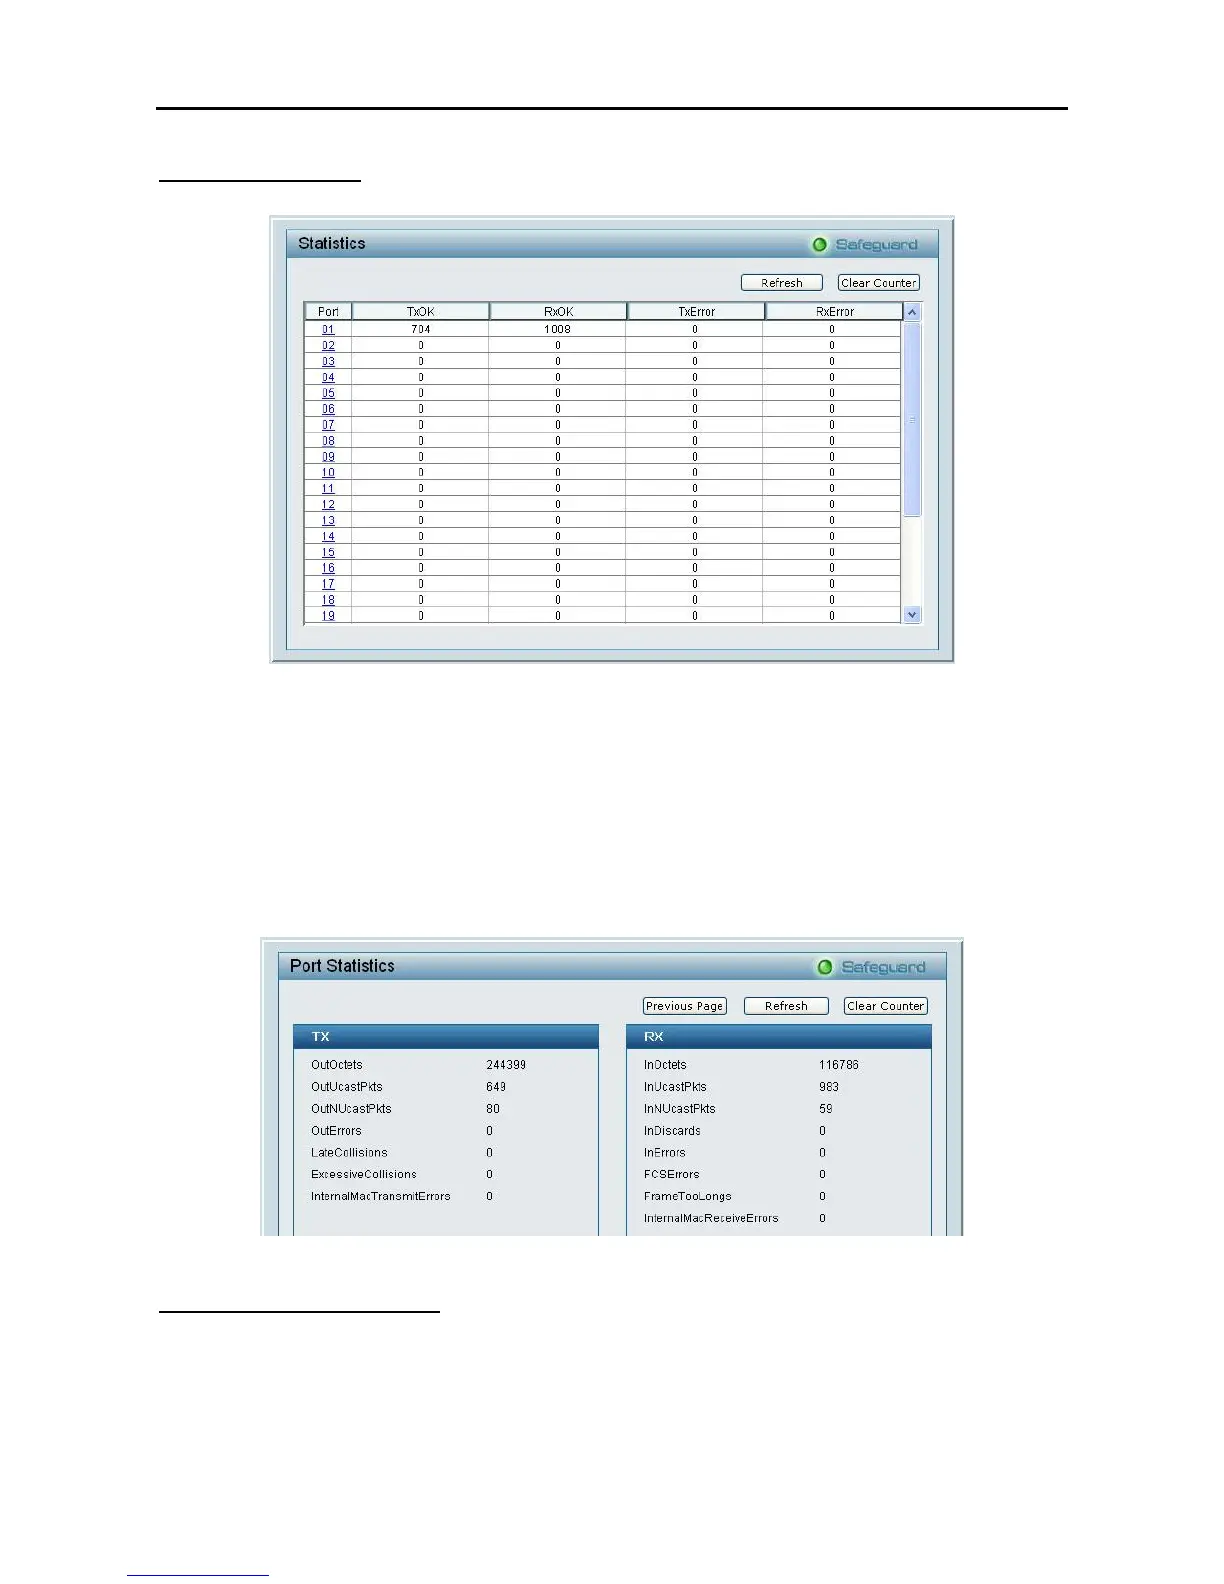
Figure 72 – Monitoring > Statistics
Refresh: To renew the details collected and displayed.
Clear Counter: To reset the details displayed.
TxOK: Number of packets transmitted successfully.
RxOK: Number of packets received successfully.
TxError: Number of transmitted packets resulting in error.
RxError: Number of received packets resulting in error.
To view the statistics of individual ports, click one of the linked Port numbers for details.
Figure 73 – Monitoring > Port Statistics
Monitoring > Cable Diagnostics
The Cable Diagnostics is designed primarily for administrators and customer service representatives to view
tests of the copper cables. It rapidly determines the type of cable errors occurred in the cable.
Select a port and then click the Test Now button to view the diagnosis.